Introduction
Here we analyse the evolution of two specific features of gender dependent personal income for three races in U.S. population: white, black and Hispanic. Our analysis includes extensive processing of actual data and theoretical consideration at the microeconomic level. In contrast to all other studies of income inequality we quantitatively predict individual incomes in a given economy together with various aggregate measures (e.g. the Gini ratio) using a complete dynamic model. This is an evolutionary model where the change of incomes is driven by one exogenous variable – real GDP per capita (for working age population) or mean personal income. This model allows to accurately describing all observed characteristics of personal income distribution. In this study, we explain the evolution of two age dependent parameters for various race/gender configurations. These two parameters are the mean income and the share of population in the Pareto distribution in the U.S. Both parameters are sensitive to gender/race configuration and their evolution is driven by real GDP per capita.
The evolution of age-dependent mean income demonstrates the overall lag between income earned by people of different gender and race, which cannot be surmounted without dramatic changes to the root social relationships between races and genders. The second feature highlights deep discrepancy in the proportion of people of different race and gender with the highest incomes (above $100,000). This disproportion is especially high for the youngest and eldest age categories. The lack of presence in the high-income range makes the shape of the age-dependent mean income distribution for all “not-white-male” groups to lag by decades behind the white-male population. Our microeconomic model of personal income distribution and evolution reveals the fact that the observed disproportion in gender and race representation in the high-income range has a measurable negative impact on real economic growth in the U.S., not saying about the extremely high level of unjustified social disparity.
Overall behaviour and model
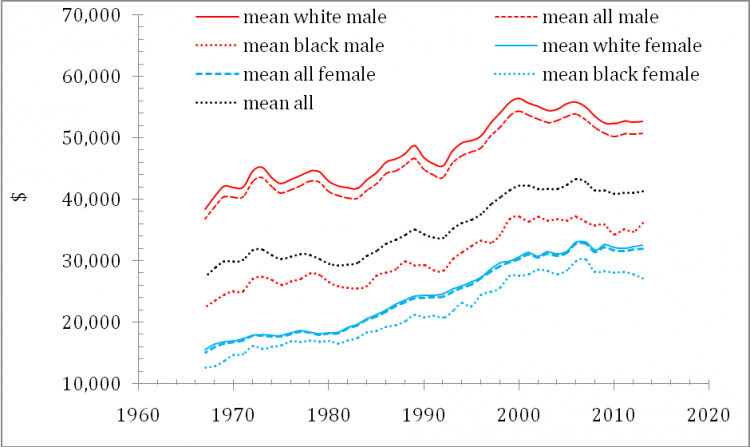
We start with a simple graph comparing trajectories of mean income for two genders and two races – white and black. Figure 1 also displays the mean personal income for all population as reported by the Census Bureau. Since white population prevails in the U.S. race structure the mean incomes for all male and female are close to those for the white. The advantage of white male over any other race and gender is obvious. The black male group is marginally above the white female one. The dominance of white male, as expressed by mean income, is obvious. Is it fair? In this study we give a negative answer to this question investigating the age-dependent mean income and the proportion of a given race-gender group in the high-income range (above $100,000).
Following the whole bulk of observations of personal income in the USA as well as in some other developed countries, our microeconomic model (here, we skip all technical details) links the change in any personal income and thus in the mean income shape with the only parameter – the level of real mean income as reported by the CB, which is shown by dotted black line in Figure 1. As a substitute, one can use real GDP per capita calculated for working age population. Mathematically, the work experience (i.e. the age of person less 15 years) for the peak mean income is proportional to the square root of real GDP per capita. For the change in real mean income from 1967 to 2013, the model of peak mean income should increase from 44 to 53 years. Figure 4 compares the observed curve of mean income dependence on age for 1998 and that predicted by the microeconomic model. The overall shape and the age of peak income are predicted with striking accuracy.

Figure 1. The evolution of gender and race (white and black) dependent mean income as reported by the Census Bureau (CB) in constant 2013 U.S. dollars. White population prevails in the U.S. race structure and thus the mean incomes for all male and female are close to those for the white population.
It is worth noting that the increasing duration of growth to peak value explains the problems with income in the youngest age group. The share of youngsters in total personal income falls with time and this is one of fundamental features of the US (as well as other developed countries) social structure. This is an intrinsic feature of any developed economy (report on some other countries is under preparation). Larger real GDP per capita implies longer way for an average person to her/his peak income and thus a slower start for the youngest population. Figure 5 demonstrates that this feature of real income behaviour is also extremely well predicted by our model. We present two actual curves of mean income for 1962 and 2012 in the range from 15 to 28 years of age as estimated from the microeconomic data obtained from the IPUMS. The difference between these curves suggests that economic conditions for the youngest population have been deteriorating. In 1962, the mean income for 28-year-olds was around 80% of the peak mean income. In 2012, this level dropped to 60%. Two predicted curves shown by red and black lines, respectively, demonstrate the accuracy of model predictions. This allows us to predict that the conditions for the youngest population will be further deteriorating as a consequence of real economic growth. The model predicts exactly what will happen in the future with personal incomes depending on real GDP per capita. Time does not matter per ce – it is just a parameter to quantify real GDP estimates. It is worth noting that the best fit model year for actual 1962 data is obtained for the year of 1958. Considering the decreasing level of accuracy of GDP and mean income estimates in the past, this difference is just marginal.