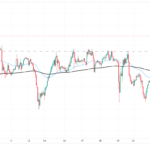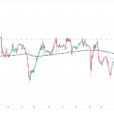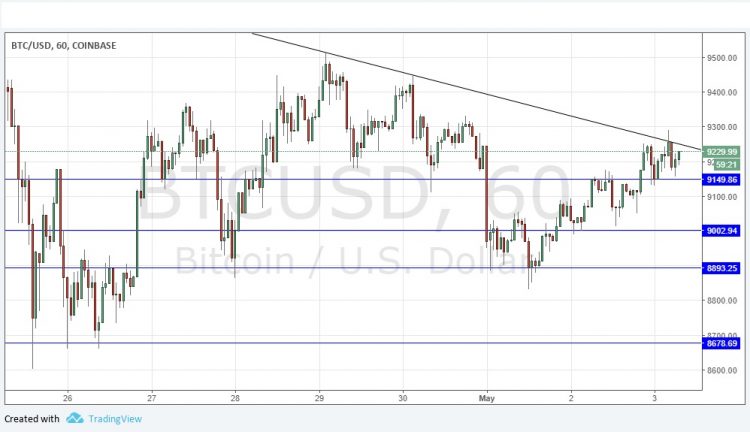
Yesterday’s signals produced a short trade from the break of the bearish engulfing candlestick which rejected the bearish trend line (shown in the price chart below) late in the Asian session. The trade would still be open at present and its outcome uncertain as there is some intraday momentum against the Dollar.
Today’s BTC/USD Signals
Risk 0.75% per trade.
Trades may only be entered until 5pm Tokyo time, over the next 24-hour period.
Long Trades
Long entry after a bullish price action reversal on the H1 time frame following the next touch of $9,150, $9,003 or $8,893.
Put the stop loss 1 pip below the local swing low.
Adjust the stop loss to break even once the trade is $200 in profit by price.
Take off 50% of the position as profit when the trade is $200 in profit by price and leave the remainder of the position to ride.
The best method to identify a classic “price action reversal” is for an hourly candle to close, such as a pin bar, a doji, an outside or even just an engulfing candle with a higher close. You can exploit these levels or zones by watching the price action that occurs at the given levels.
BTC/USD Analysis
I wrote yesterday that I expected that the action was likely to be messy and hard to predict, so day traders might be wise to stand aside for the time being. I was wrong to some extent, the price has in fact made a move up, but has rejected the bearish trend line which I drew in the chart. The momentum seems relatively bullish, but this would have to be confirmed by a decisive break above the trend line. If the price does get established above there, it has space to rise higher as there are no obvious strong resistance levels until the big round number at $10,000 is reached. I have a bearish bias below the trend line, and a bullish bias above it.