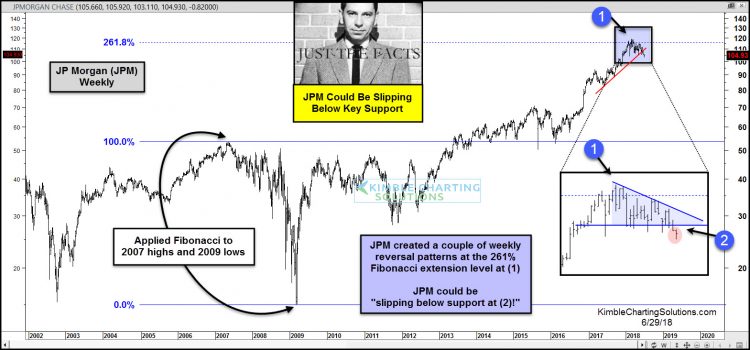
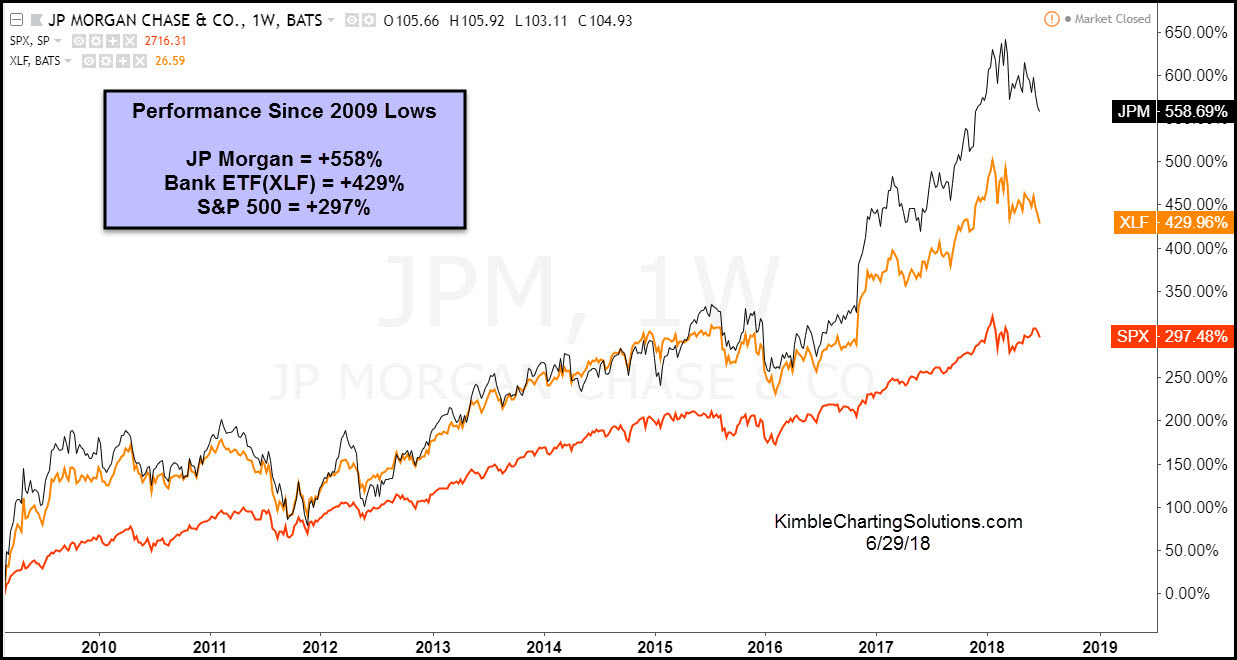
The chart above looks at JP Morgan (JPM) over the past 16-years. JP Morgan has been done very well since the 2009 lows, as its gains have surpassed the S&P 500 and Banks overall by a large percent (See Chart below).
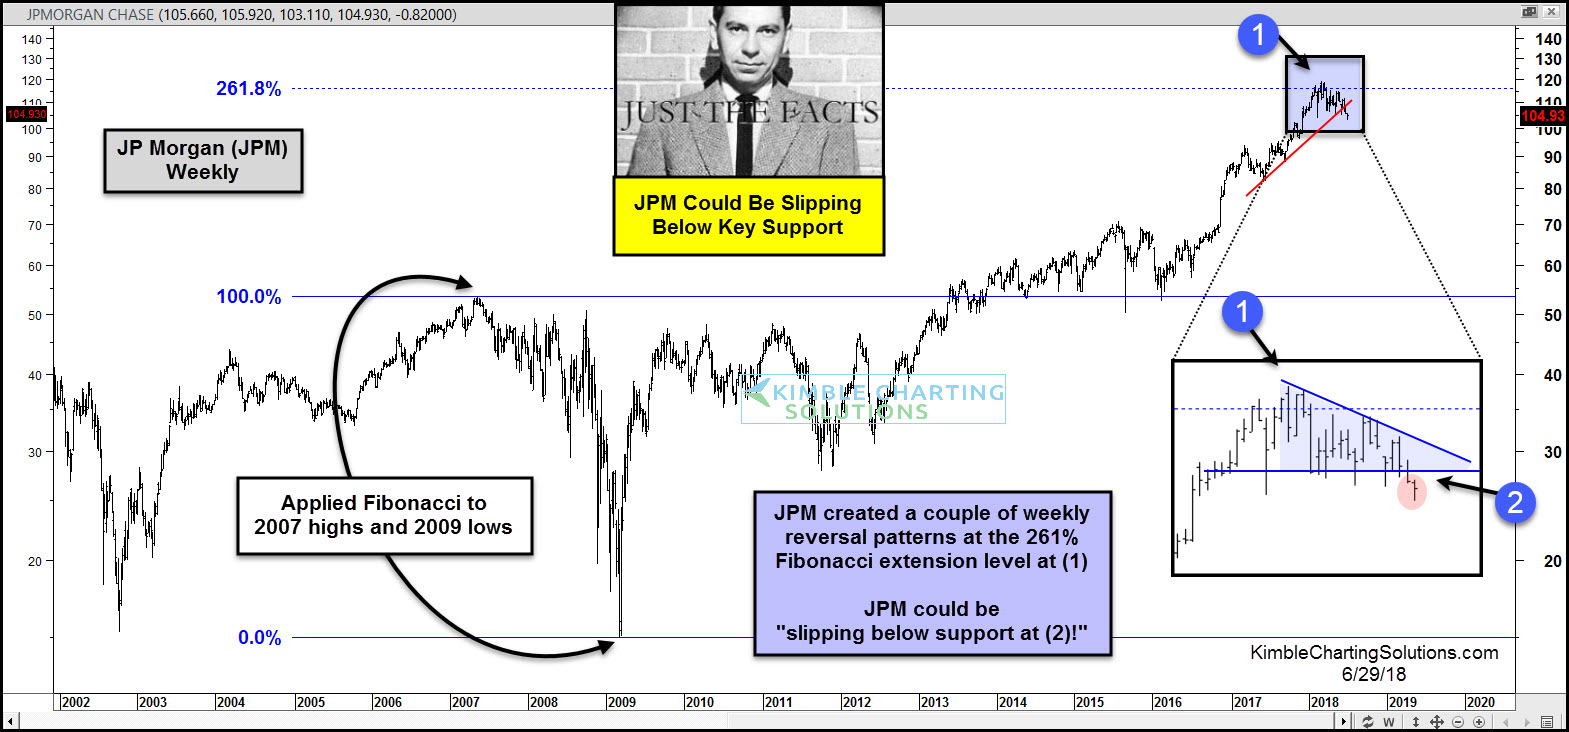
We applied Fibonacci to the 2007 highs and 2009 lows for JPM. It hit the 261% extension level at (1) earlier this year and started creating a couple of reversal patterns. Since hitting the 261% level, JPM has been soft and could be creating a bearish descending triangle pattern.
Joe Friday Just The Facts Ma’am– JPM could be slipping below support (2018) lows at (2). What this market leader does at (2), will be important to the stock, the banking sector and the overall market!
Stock market bulls would get a bulls price message if JPM can climb back above support at (2). Stock market bulls would get a caution message from JPM if it kisses the underside of 2018 lows and selling pressure continues.
Keep a close eye on what JPM does at (2), as it will send an important message to the banking sector and the broad market too.