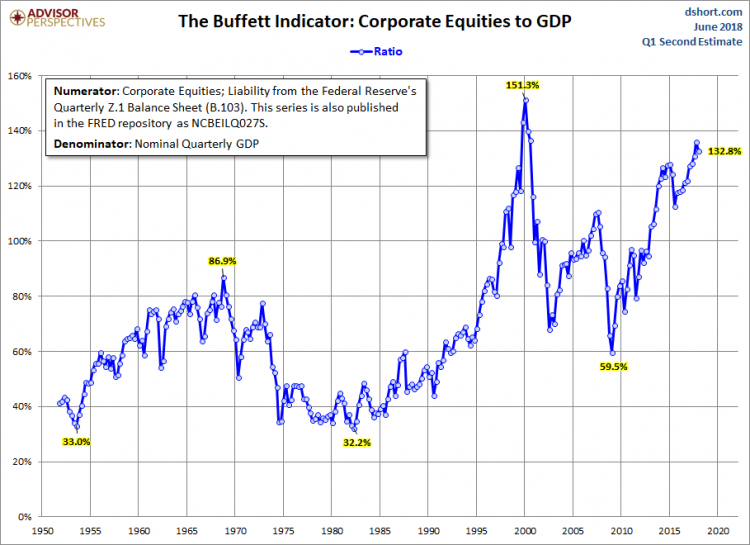
Market Cap to GDP is a long-term valuation indicator that has become popular in recent years, thanks to Warren Buffett. Back in 2001, he remarked in a Fortune Magazine interview that “it is probably the best single measure of where valuations stand at any given moment.”
The four valuation indicators we track in our monthly valuation overview offer a long-term perspective of well over a century. The raw data for the “Buffett indicator” only goes back as far as the middle of the 20th century. Quarterly GDP dates from 1947, and the Fed’s balance sheet has quarterly updates beginning in Q4 1951. With an acknowledgment of this abbreviated timeframe, let’s take a look at the plain vanilla quarterly ratio with no effort to interpolate monthly data.
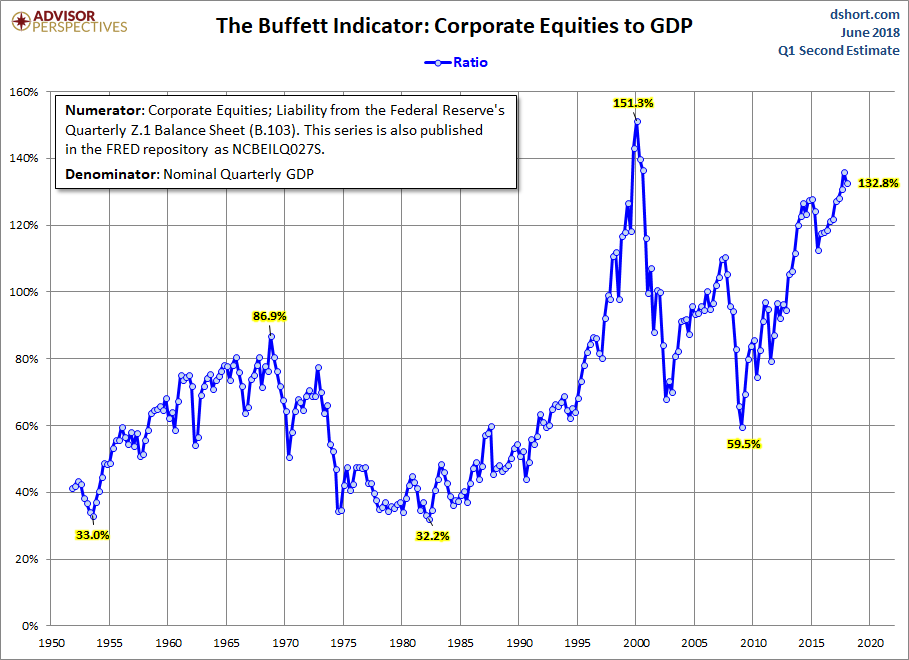
The strange numerator in the chart title, NCBEILQ027S, is the FRED designation for Line 41 in the B.103 balance sheet (Market Value of Equities Outstanding), available on the Federal Reserve website. Incidentally, the numerator is the same series used for a simple calculation of the Q Ratio valuation indicator.
The Latest Data
The denominator in the charts below now includes the Second Estimate of Q1 GDP and the latest Z.1 data. The latest numerator value, when the latest data is not yet available, is extrapolated based on the quarterly change in the Wilshire 5000. The current reading is 132.8%, up from 136.0% the previous quarter.
Here is a more transparent alternate snapshot over a shorter timeframe using the Wilshire 5000 Full Cap Price Index divided by GDP. We’ve used the St. Louis Federal Reserve’s FRED repository as the source for the stock index numerator (WILL5000PRFC). The Wilshire Index is a more intuitive broad metric of the market than the Fed’s rather esoteric “Nonfinancial corporate business; corporate equities; liability, Level”.
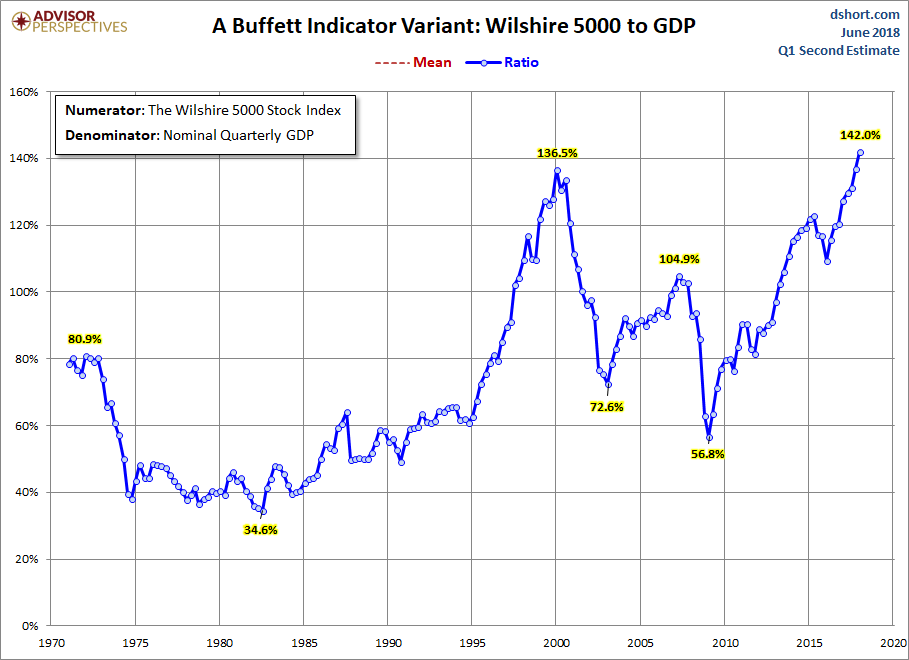
A quick technical note: To match the quarterly intervals of GDP, for the Wilshire data we’ve used the quarterly average of daily closes rather than quarterly closes (slightly smoothing the volatility) when the latest data is not yet available.