Key Takeaways
- Bitcoin is steadily rising toward $46,000 with little to no opposition ahead.
- Ethereum regained a significant support cluster that could fuel an upswing to $3,000.
- XRP presented a buy signal that has now been confirmed, presenting a target of $1.00.
The cryptocurrency markets have kicked off the week with a bang. Bitcoin, Ethereum, and XRP jumped by more than 9% over the past 24 hours, liquidating nearly $1 billion worth of short positions. Now that doubters are partially out of the market, these cryptos could be looking for further gains.
Bitcoin Targets $46,000
Bitcoin is back in the green following a two-month-long consolidation period. The cryptocurrency’s price action had developed a descending triangle on the daily chart, aiming for further lows—however, the pattern broke out to the upside on July 23.
Since then, BTC has gone up by more than 23%, and it seems to be aiming for higher highs.
The weekend pump to highs of $40,000 caused short order liquidations of nearly $1 billion. The interest rate for short and long orders has reached near-zero values, providing a neutral ground for a pump or dump on either side.
The height of the triangle’s y-axis added to the breakout point suggests that Bitcoin could gain another 6,400 points. A steady increase in BTC demand might have the strength to push prices beyond the 200-day moving average at $44,600. The descending triangle pattern on Bitcoin’s daily chart forecasts a bullish target of $46,200.


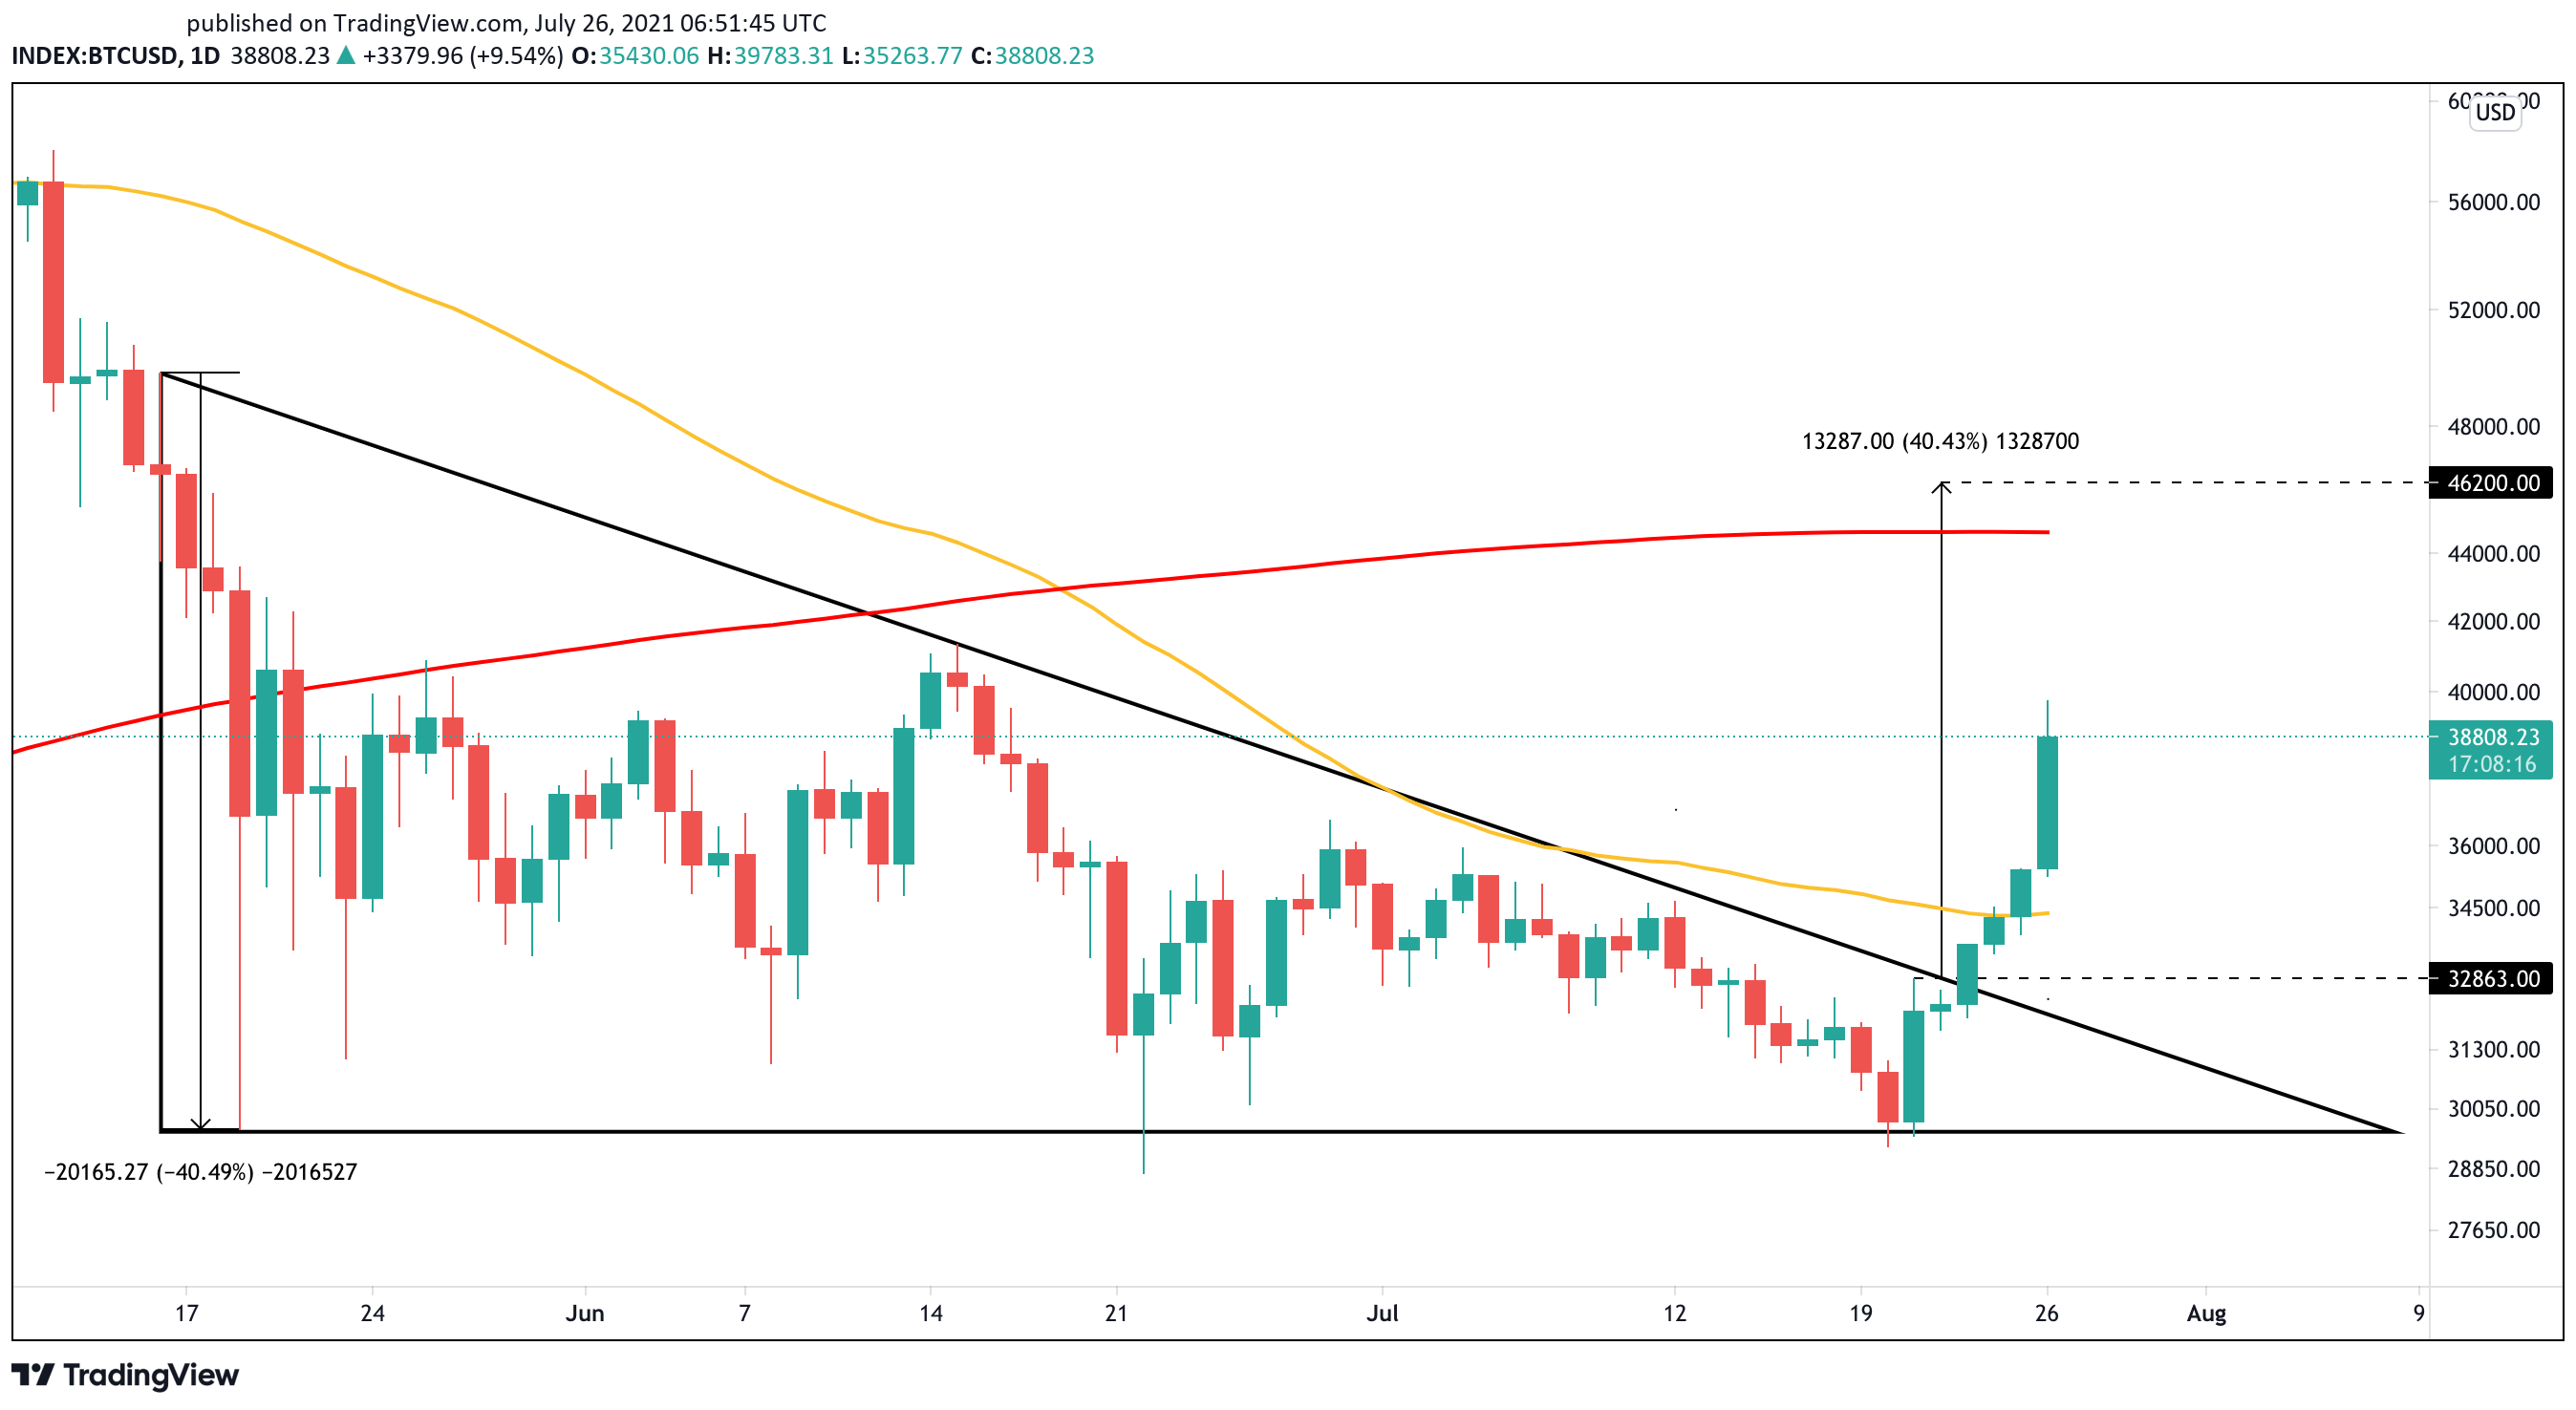
A sudden spike in selling pressure that sends Bitcoin below this critical demand wall could lead to significant losses. BTC might drop to retest the $29,600 level, and if this support fails to hold, then a steeper correction to the 2017 all-time high of nearly $20,000 seems imminent.
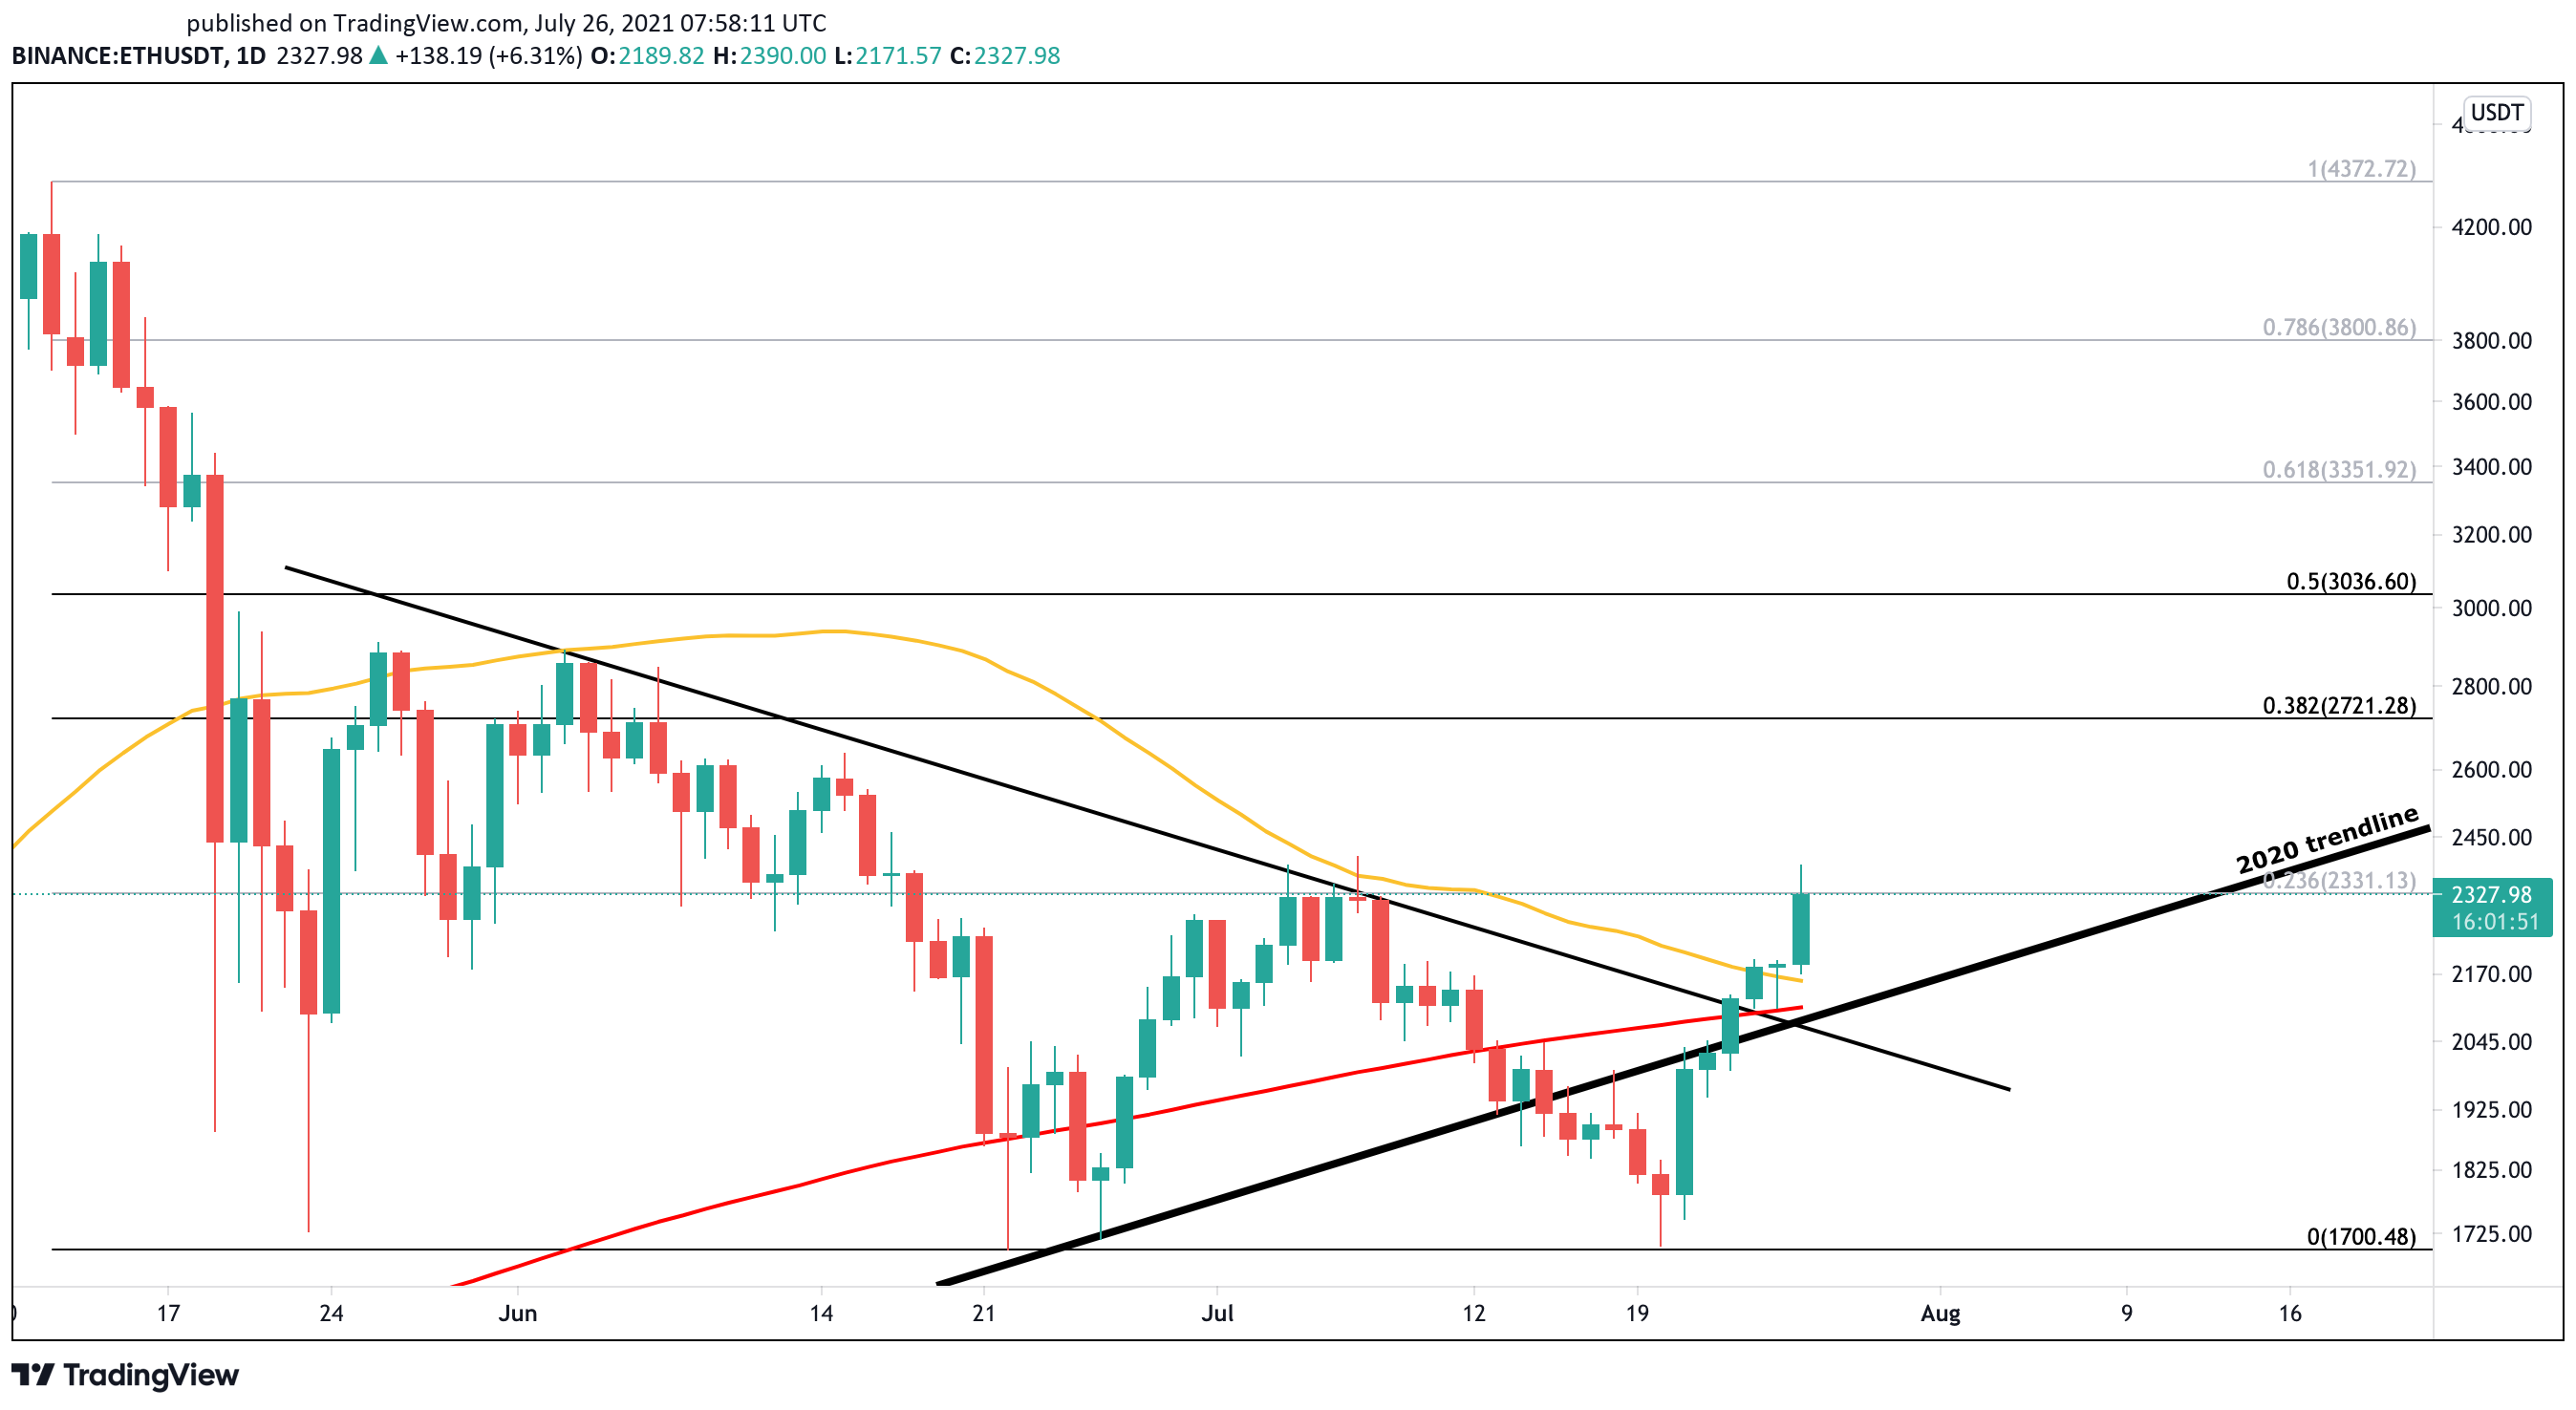
Ethereum Reclaims Vital Support
Ethereum managed to bounce off the $1,700 support level for the fourth consecutive time since May 23, avoiding a catastrophic outlook.
The most recent rebound was supported by high volume, which allowed ETH to reclaim several vital support areas. These include a rising trendline that formed following the “Black Thursday” crash of March 2020, as well as the 50- (in yellow) and 200-day (in red) moving averages.
Now that Ethereum sits on top of stable support, it may have the buying pressure behind it to advance further. The Fibonacci retracement extension from May 12’s high of $4,372 to June 22’s low of $1,700 suggests that Ether could rise toward $3,000.

A daily candlestick close above the 23.60% Fibonacci retracement level at $2,330 could serve as the first confirmation that Ethereum would likely target the 38.20% or 50.00% Fibonacci retracement level. These resistance levels sit at $2,720 and $3,040, respectively.
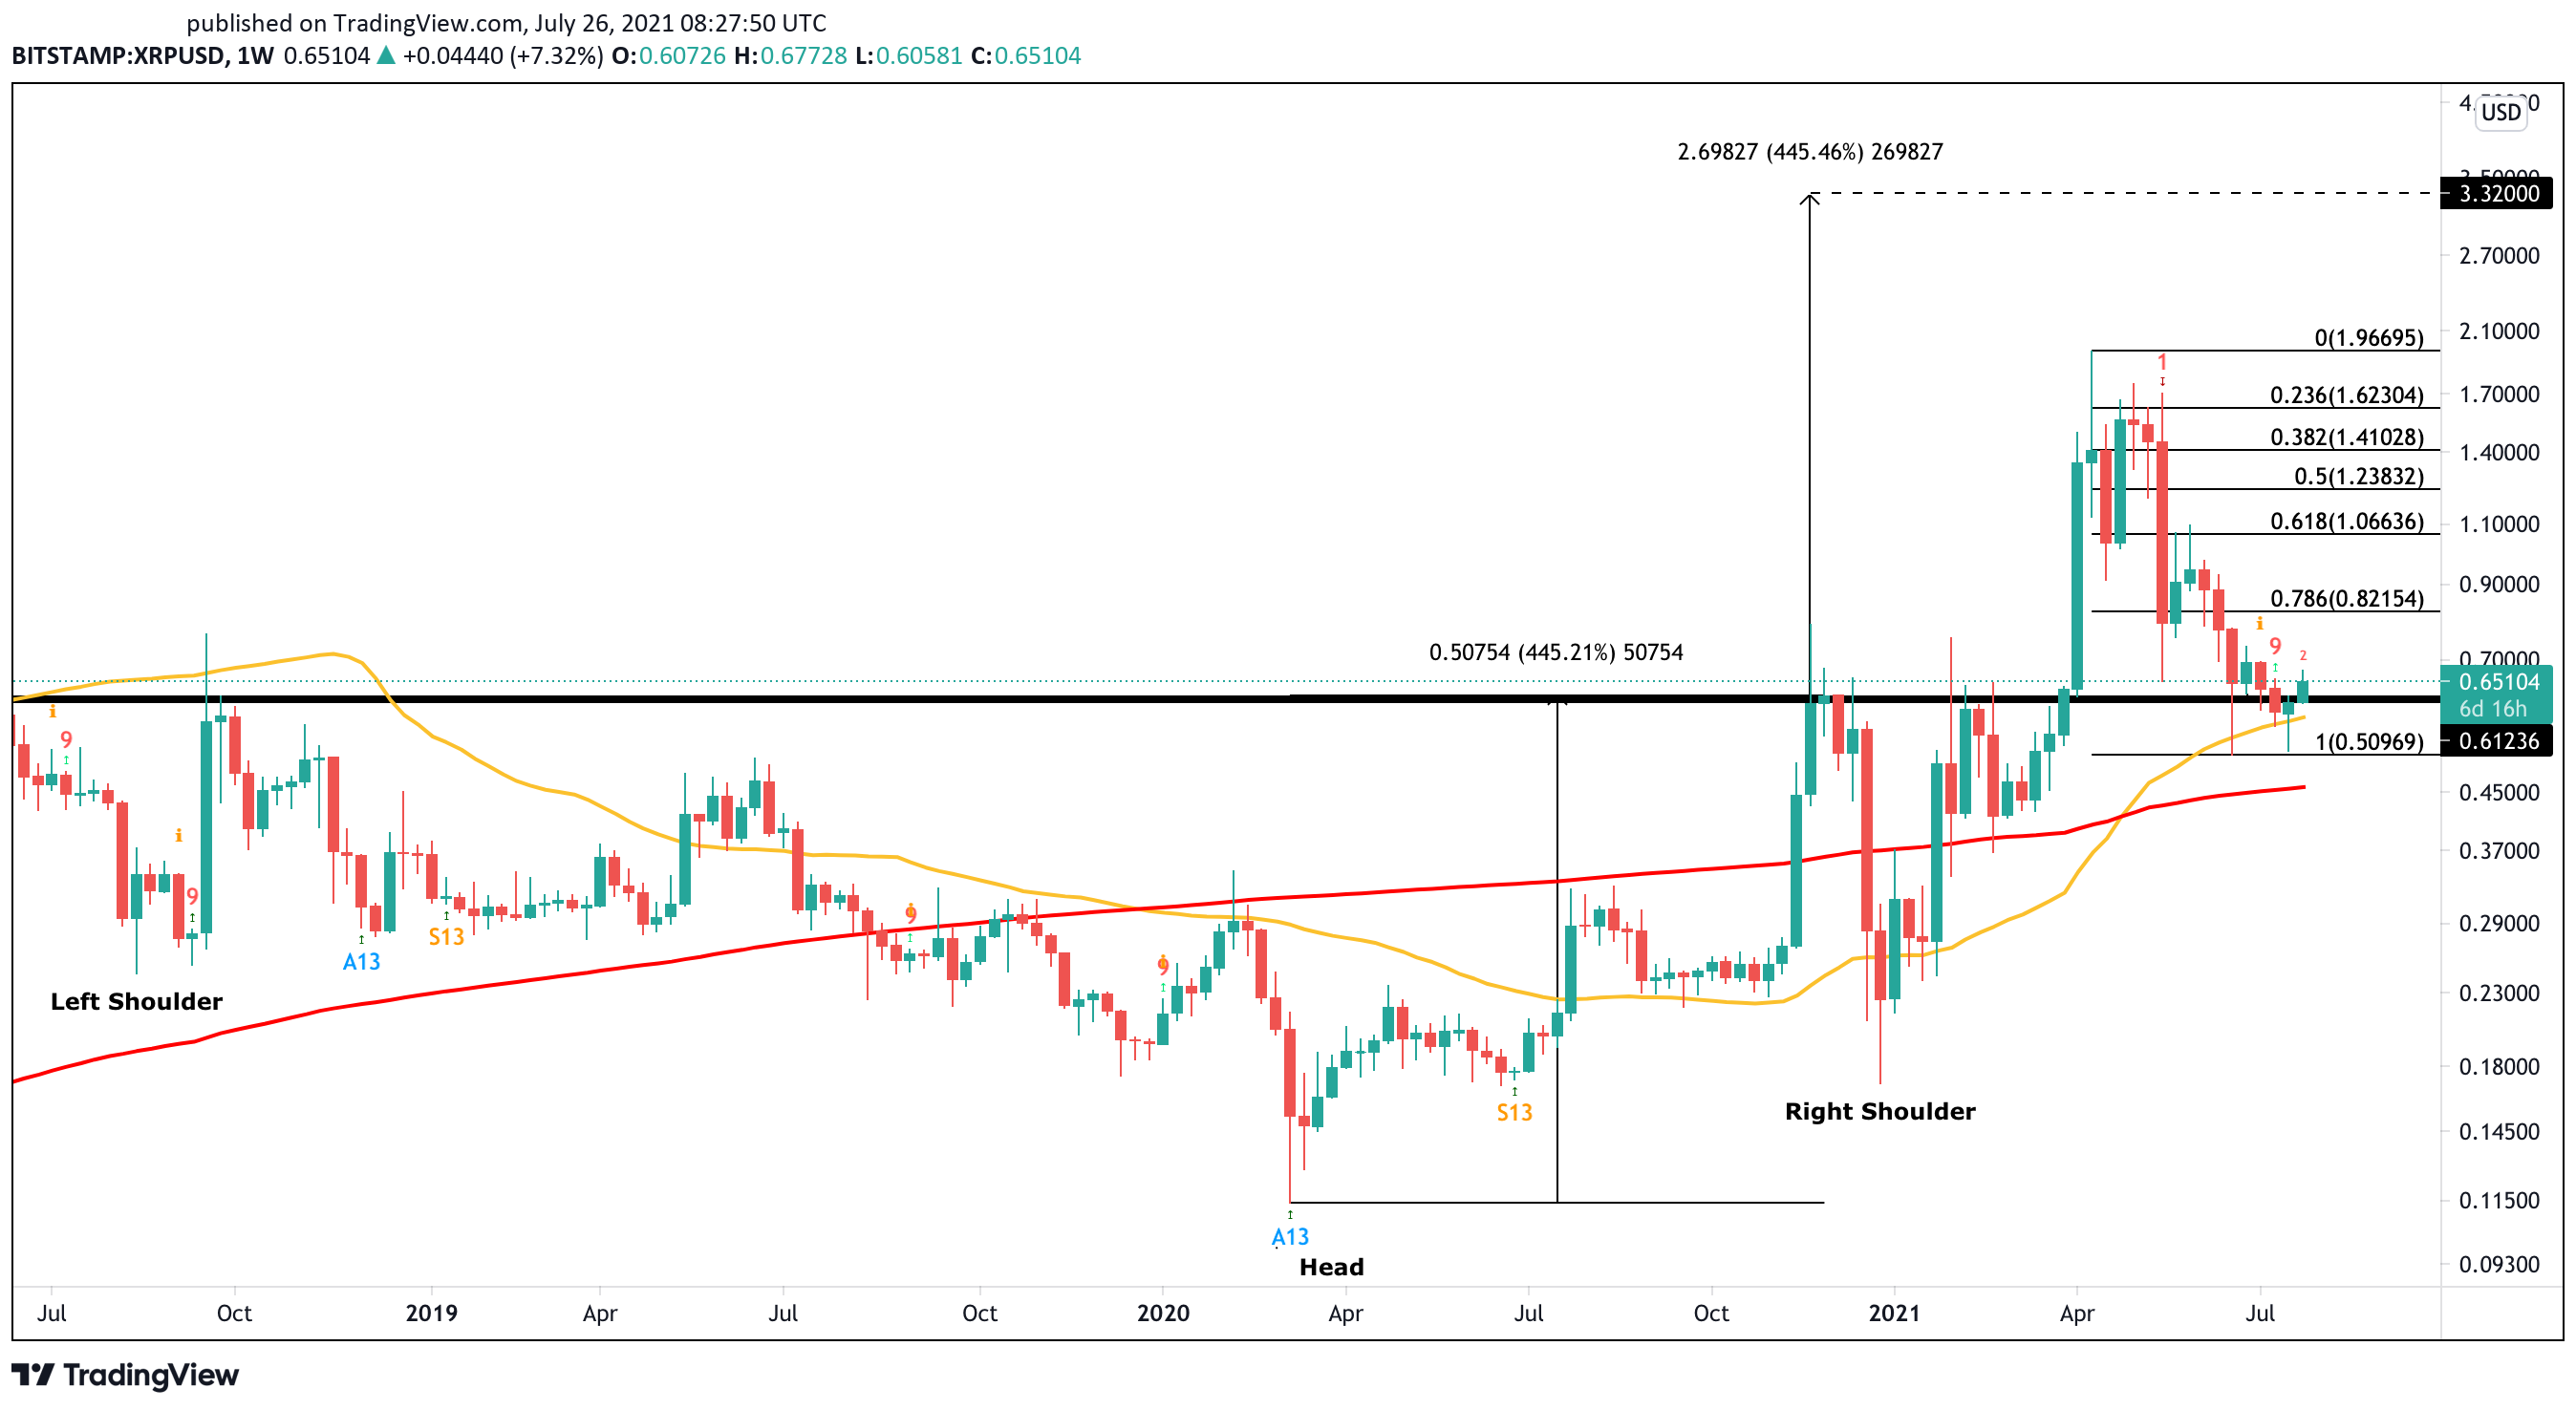
XRP Flashes Buy Signal
XRP saw its price skyrocket by a whopping 220% in April after breaking out of a multi-year head-and-shoulders pattern that had formed on its weekly chart. The sudden spike in buying pressure pushed this cryptocurrency to nearly $2.00. But as investors began to book profits, prices reversed to the pattern’s neckline at $0.61.
Interestingly, the Tom DeMark (TD) Sequential indicator recently presented a buy signal within the same time frame. The bullish formation developed as a red nine candlestick, pointing towards a one-to-four candlesticks upswing in the coming weeks.
Since XRP has been able to hold above the 50-week moving average, the odds for a substantial rebound are high. Further buying pressure could see the sixth-largest cryptocurrency by market capitalization target $0.82 or even $1.00.