Key Takeaways
- More than $300 billion was wiped out of the entire cryptocurrency market cap during Tuesday’s crash.
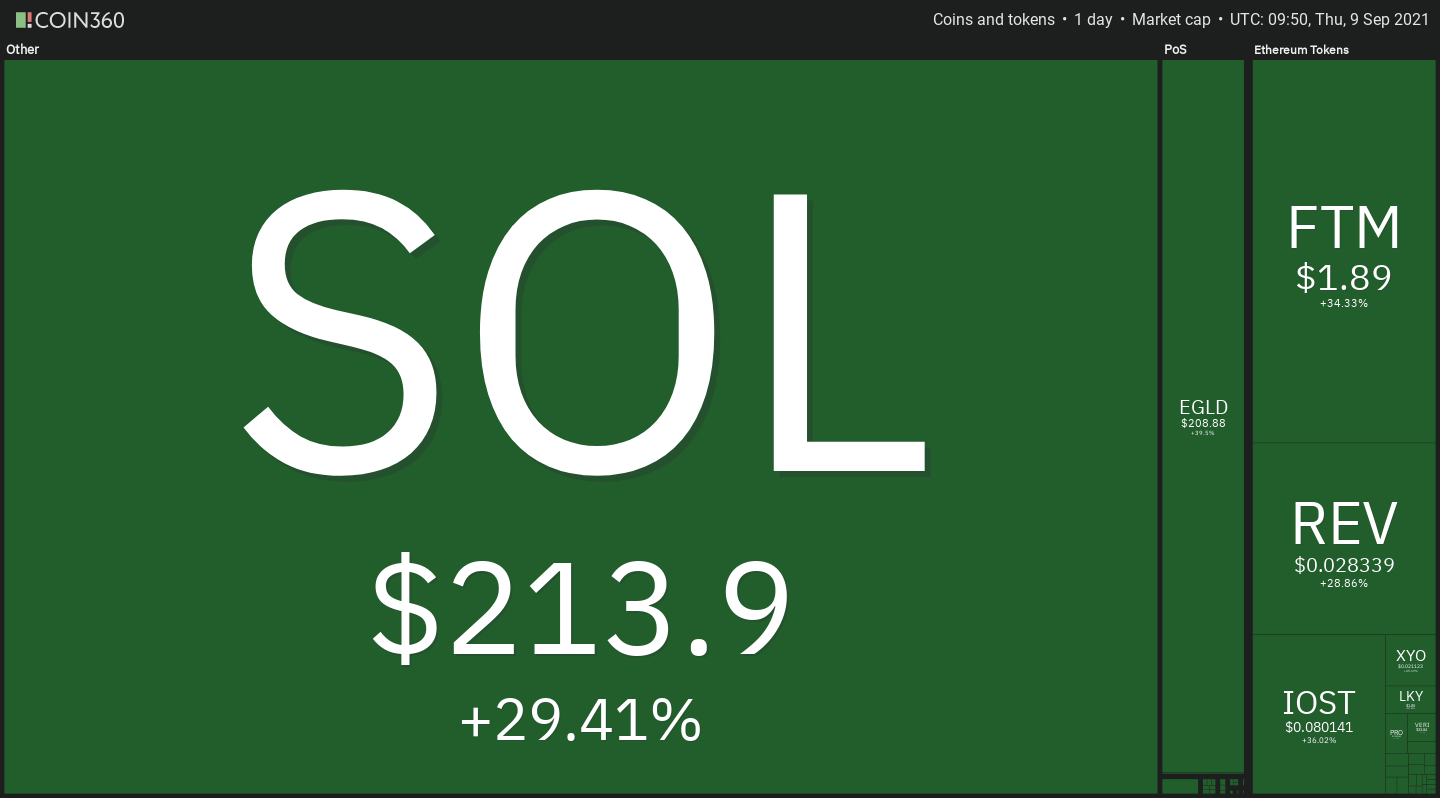
- Solana and Fantom managed to weather the storm and rebound strongly.
- Both cryptocurrencies have made new all-time highs, luring investors into long positions.
Solana and Fantom have quickly recovered from the market’s recent flash crash. Both assets now sit at crucial support levels that could propel them into higher highs.
Layer 1 Coins Post V-Shaped Recovery
Solana and Fantom are among the altcoins that have gained pace since the cryptocurrency market experienced one of its steepest flash crashes of the year.
Although more than $3.5 billion in liquidations were generated across the board after the market dipped Tuesday, some investors appear to have taken advantage of the correction to buy tokens at a discount. Behavior analytics platform Santiment has pointed out that mentions of “buy” and “dip” together have skyrocketed, suggesting a bullish bias among retail investors.
The significant increase in buying pressure has allowed several digital assets to recover to new all-time highs.


Further buying pressure could see both digital assets make higher highs.
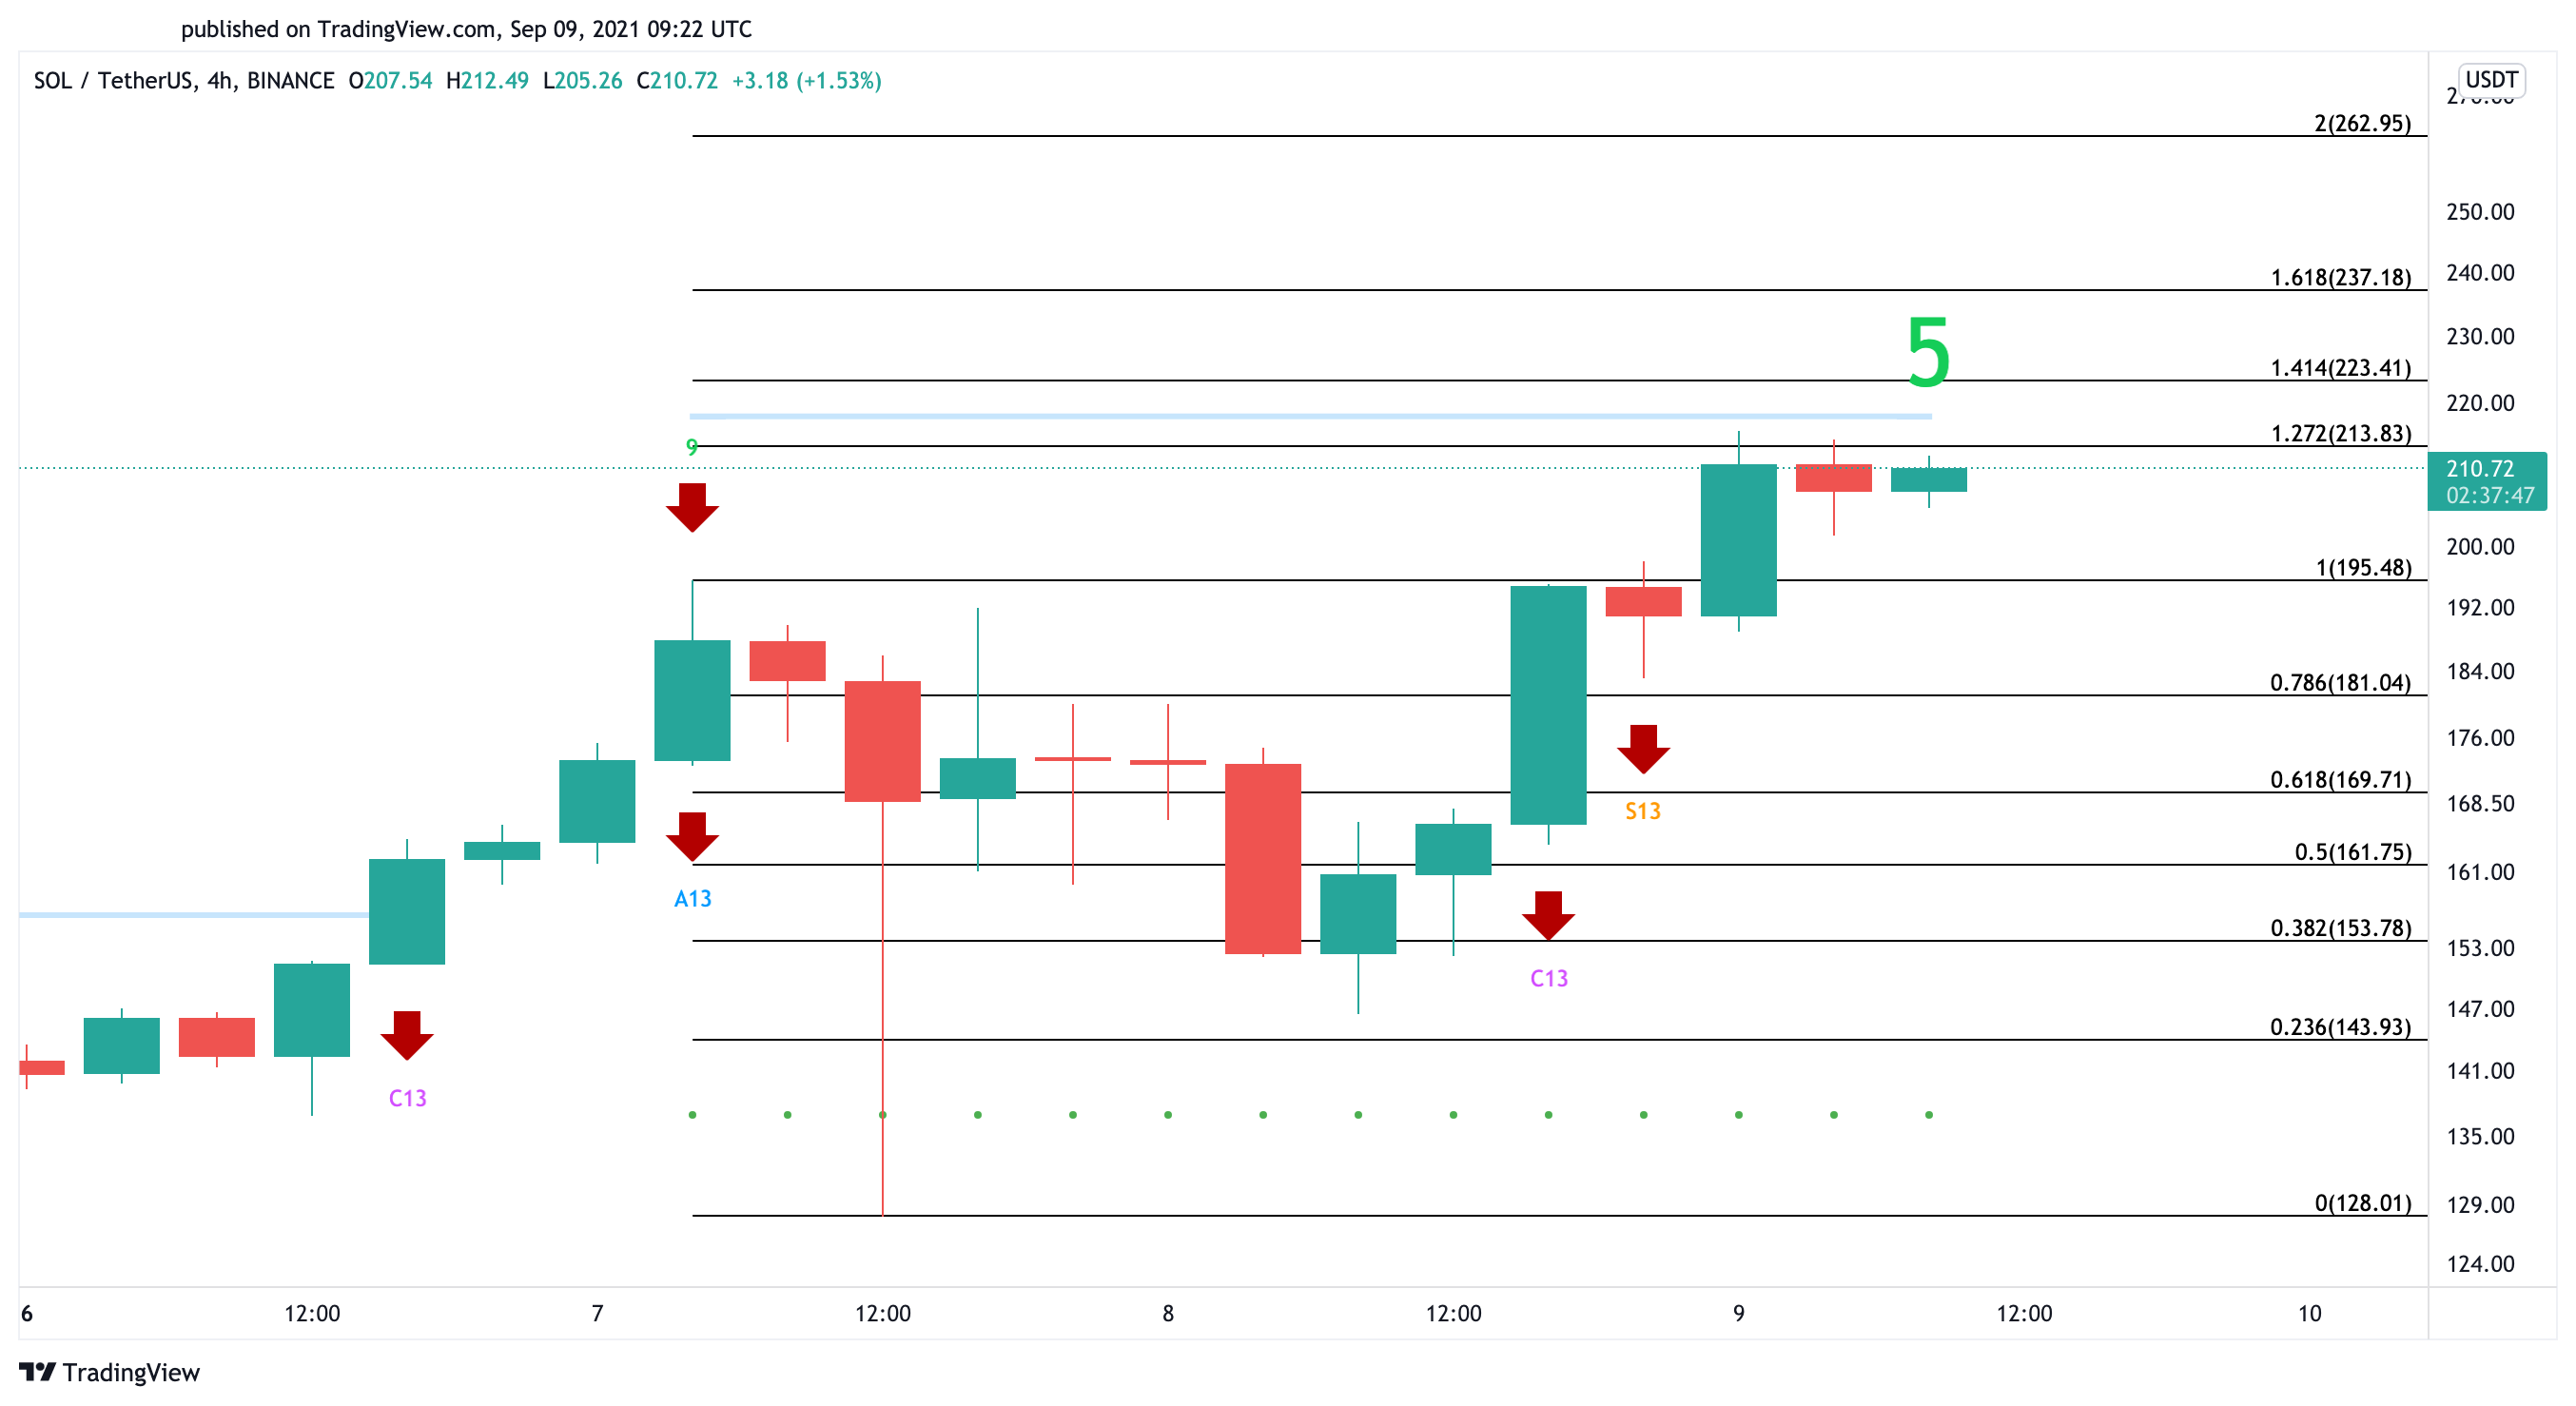
Solana in Price Discovery Mode
The four-hour chart suggests that Solana is trying to overcome a psychological resistance level that lies between $213 and $218.
Given the significant gains that this cryptocurrency has posted over the last few months, it seems that investors remain cautious about a potential spike in profit-taking. Only a four-hour candlestick close above this barrier would signal the continuation of the uptrend.

By slicing through the $213 to $218 region, Solana might attract a new wave of buyers that push prices further up. Based on the Fibonacci retracement indicator, SOL could target $237 or even $263 upon the break of the overhead resistance.
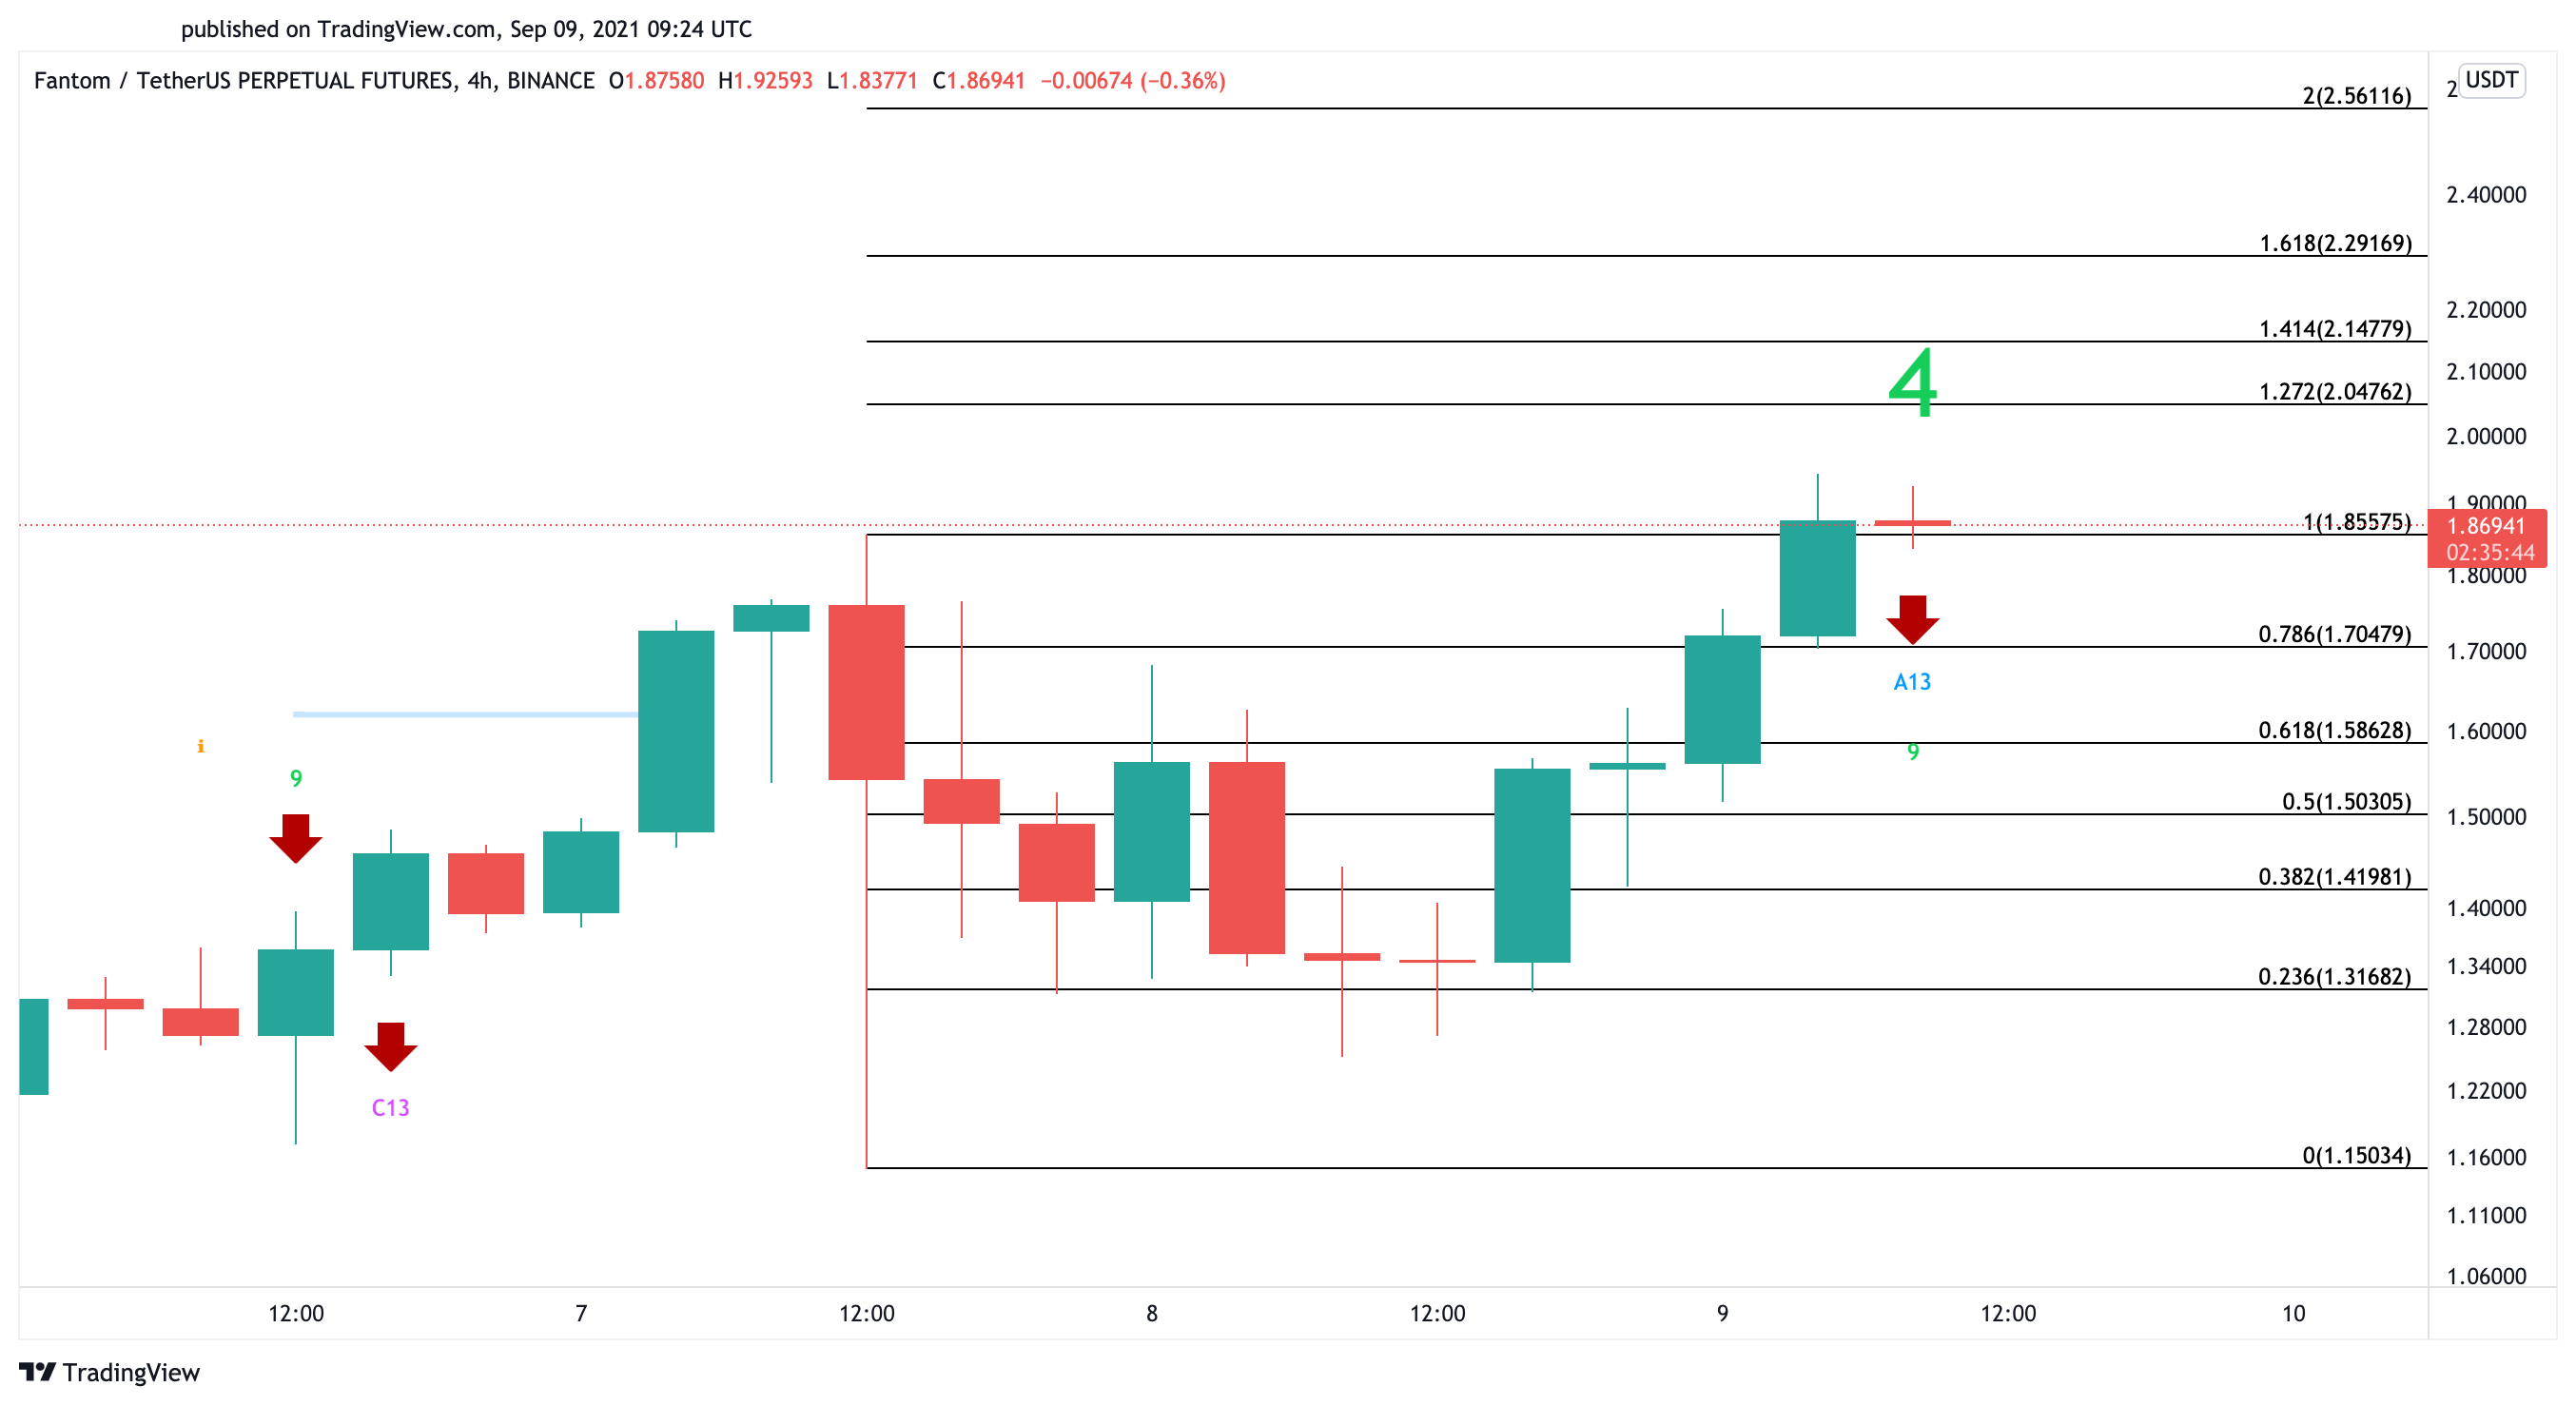
Fantom Lures Investors
Fantom bounced strongly off the $1.15 support level after taking a 38% nosedive. The bullish impulse was significant enough to push FTM to a new all-time high of $1.94. Now, the Tom DeMark (TD) Sequential indicator has presented a warning signal to investors looking to buy in.
The TD setup flashed an aggressive 13 candlestick on the four-hour chart, which can be considered a sell signal. A spike in selling pressure could push Fantom toward the 61.8% or 50% Fibonacci retracement level. These support levels sit at $1.58 and $1.50 respectively.