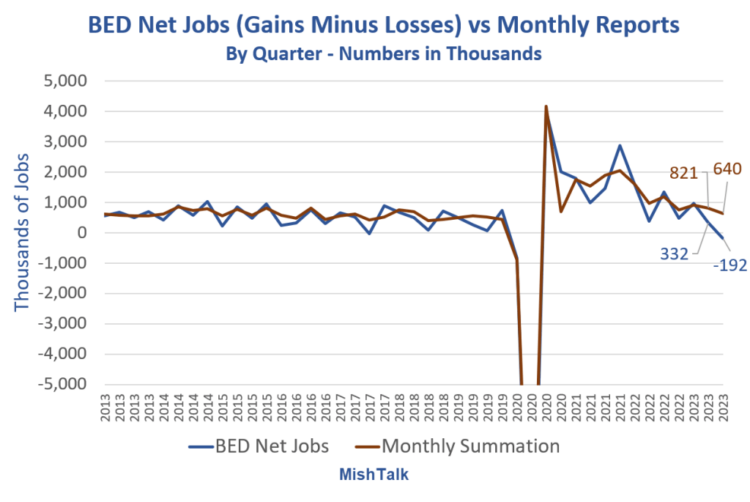
 Business Employment Dynamics (BED) data and Monthly Job Data both from the BLS, chart by Mish
BED Chart Notes
BED Job Gains and Losses by Quarter
Summary of Major Differences 
Note that BED data is based on 9.1 million establishments while the monthly jobs reports are only based on 670,000 establishments.The monthly reports are timely but inaccurate. And the BLS annual benchmark revisions do not also revise the monthly numbers. This makes year-over-year comparisons inaccurate as well.I created the lead chart by netting BED data and comparing the BED net jobs to net quarterly jobs from the CES data.
BED vs CES
CES Overstatement
Thus, the BLS says that the BLS monthly job reports for 2023 Q2 and Q3 are overstated by a total of 1.321 million jobs.
Jobs Up 303,000 Full Time Employment Down 6,000 in MarchIn March, the economy continued to add a high percentage of government and social assistance jobs. Part time employment rose by 691,000 as full time employment fell by 6,000.  Nonfarm payrolls and employment levels from the BLS, chart by Mish.Not that anyone can trust the numbers, but the most recent jobs report shows Jobs Up 303,000 Full Time Employment Down 6,000 in MarchFor all the faith put in the monthly establishment CES Nonfarm Payrolls, the household survey provided a much more believable set of numbers (red and yellow lines).
Payrolls vs Employment Gains Since March 2023
Payrolls vs Employment Gains Since May 2022
Payrolls are up by 6.2 million since May of 2022, but full time employment up only 264 thousand.
Change in Gov’t and Social Assistance Jobs  What jobs are being created now are of dubious quality. The percentage of government and social assistance jobs to take care of the illegal immigration surge is staggering.
Denver Migrants Make 20,000 Emergency VisitsI discussed Denver on January 24. Please note Denver Health at “Critical Point” as 8,000 Migrants Make 20,000 Emergency VisitsThe Denver hospital system is turning away local residents because it is flooded with migrant visits.What’s happening in Denver is also happening in Chicago, New York City, and all the other migrant havens.
2024 Q1 GDP Underperforms Expectations at 1.6 Percent vs 2.3 Percent ExpectedThis morning, I reported 2024 Q1 GDP Underperforms Expectations at 1.6 Percent vs 2.3 Percent Expected
First-quarter GDP was lower than any estimate in the Bloomberg Econoday consensus range of of 1.7 percent to 2.8 percent. Inflation was higher than expected.
Expect Negative RevisionsExpect major revisions not only to the annual BLS benchmark revisions, but also to GDP.The BED report lends huge credence to the idea that GDP data is overstated and Gross Domestic Income numbers (reflecting payrolls) are more accurate.More By This Author:2024 Q1 GDP Underperforms Expectations At 1.6 Percent Vs 2.3 Percent ExpectedTesla Rebounds On Musk Promises With No Details, It Won’t StickARK Destroyed More Wealth Than Any Asset Manager Over The Previous Decade