We have a normal economic calendar, but a very short week. Many market participants will head for home early on Wednesday for an extended weekend. Some will skip this week entirely. We’ll have interesting data on housing, sentiment, and leading indicators, all reported in a three-day period. The prediction for Friday is easy. The annual Black Friday coverage will take center stage. With these sales starting earlier and earlier, I expect the pundits to join earlier as well. They will be asking: Will holiday shopping provide a needed economic boost?
Last Week Recap
In my last edition of WTWA I guessed that the stock rebound from the lows would have the punditry wondering if the market storm had been averted. With Monday’s decline of about 2%, that question did not last long. Even small news tidbits about tariffs seemed to have a significant intra-day effect.
The Story in One Chart
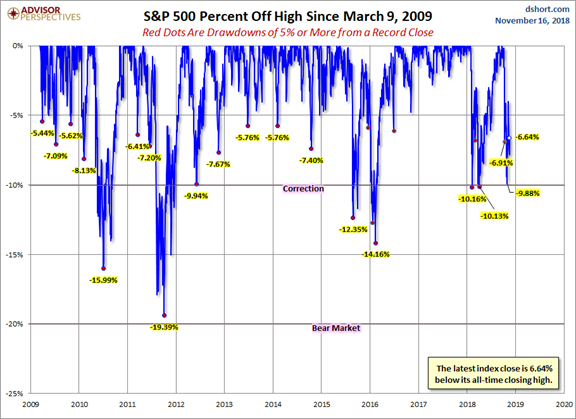
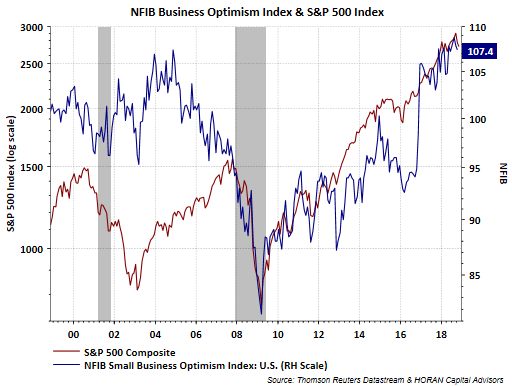
I always start my personal review of the week by looking at a great chart. This week I am featuring Jill Mislinski. She includes a lot of relevant information in a single picture – worth more than a thousand words. Read the full post for more great charts and background analysis.
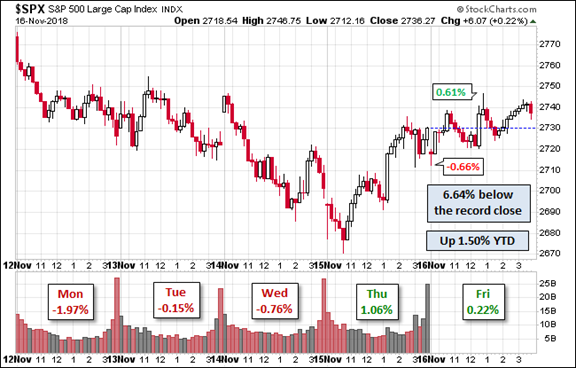
The market lost 1.6% and the weekly trading range was 3.8%. I summarize actual and implied volatility each week in our Indicator Snapshot section below. Let’s also check in on the history of drawdowns. [Some readers have inquired about the percentages in this chart. The YTD seems to be based upon the closing price of the first day of trading in 2018. The other callouts show daily changes and the Friday range. The volume bars are also helpful. It is a lot of information in one chart].
Personal Notes
I had a chance to discuss my approach, background, and interactions with investors in a podcast interview this week with Gil Weinreich. Readers who have never spoken with me might want to find out what I sound like.
I will be in the office this week, but plan to spend evenings and Thanksgiving with Mrs. OldProf and family. I thank all my readers, especially those who have commented, encouraged, and made suggestions over the last year. It is a time of turbulence and special distress for many, but we have much to be thankful for.
The News
Each week I break down events into good and bad. For our purposes, “good” has two components. The news must be market friendly and better than expectations. I avoid using my personal preferences in evaluating news – and you should, too.
New Deal Democrat’s high frequency indicators are an important part of our regular research. This week reflects further softening in the long leading indicators, which have turned negative. NDD takes note of the effect of tariffs. He is not on his one-year recession watch, pending further and persistent weakness.
When relevant, I include expectations (E) and the prior reading (P).
The Good
Earnings season (with reports in from 92% of the S&P 500 companies) has been excellent on nearly all fronts. John Butters (FactSet) summarizes his “Key Metrics.” The entire report is loaded with valuable information.
Earnings Scorecard:
For Q3 2018 (with 92% of the companies in the S&P 500 reporting actual results for the quarter), 78%
of S&P 500 companies have reported a positive EPS surprise and 61% have reported a positive sales surprise.
Earnings Growth:
For Q3 2018, the blended earnings growth rate for the S&P 500 is 25.7%. If 25.7% is the actual growth
rate for the quarter, it will mark the highest earnings growth since Q3 2010.
Earnings Revisions:
On September 30, the estimated earnings growth rate for Q3 2018 was 19.3%. All eleven sectors have
higher growth rates today (compared to September 30) due to positive EPS surprises and upward revisions to EPS estimates.
Earnings Guidance:
For Q4 2018, 61 S&P 500 companies have issued negative EPS guidance and 27 S&P 500 companies
have issued positive EPS guidance.
Valuation:
The forward 12-month P/E ratio for the S&P 500 is 15.6. This P/E ratio is below the 5-year average (16.4) but
above the 10-year average (14.5).
He also notes that companies have not been rewarded for good results but have been punished for misses.
The Bad
Steven Hansen (GEI) takes his customary deep dive, looking at moving averages and year-over-year data, as well as the upward revisions.
The Ugly
Wildfires. Not only larger, but different in character. Fast-moving and destroying large swaths of territory. The loss of life and property is correspondingly higher. One mission is to provide as much help, as quickly as possible. Later there will be time to ponder needed changes in public policy.