Key Takeaways
- The Tom DeMark Sequential indicator has flashed sell signals on Bitcoin and Ethereum’s daily charts.
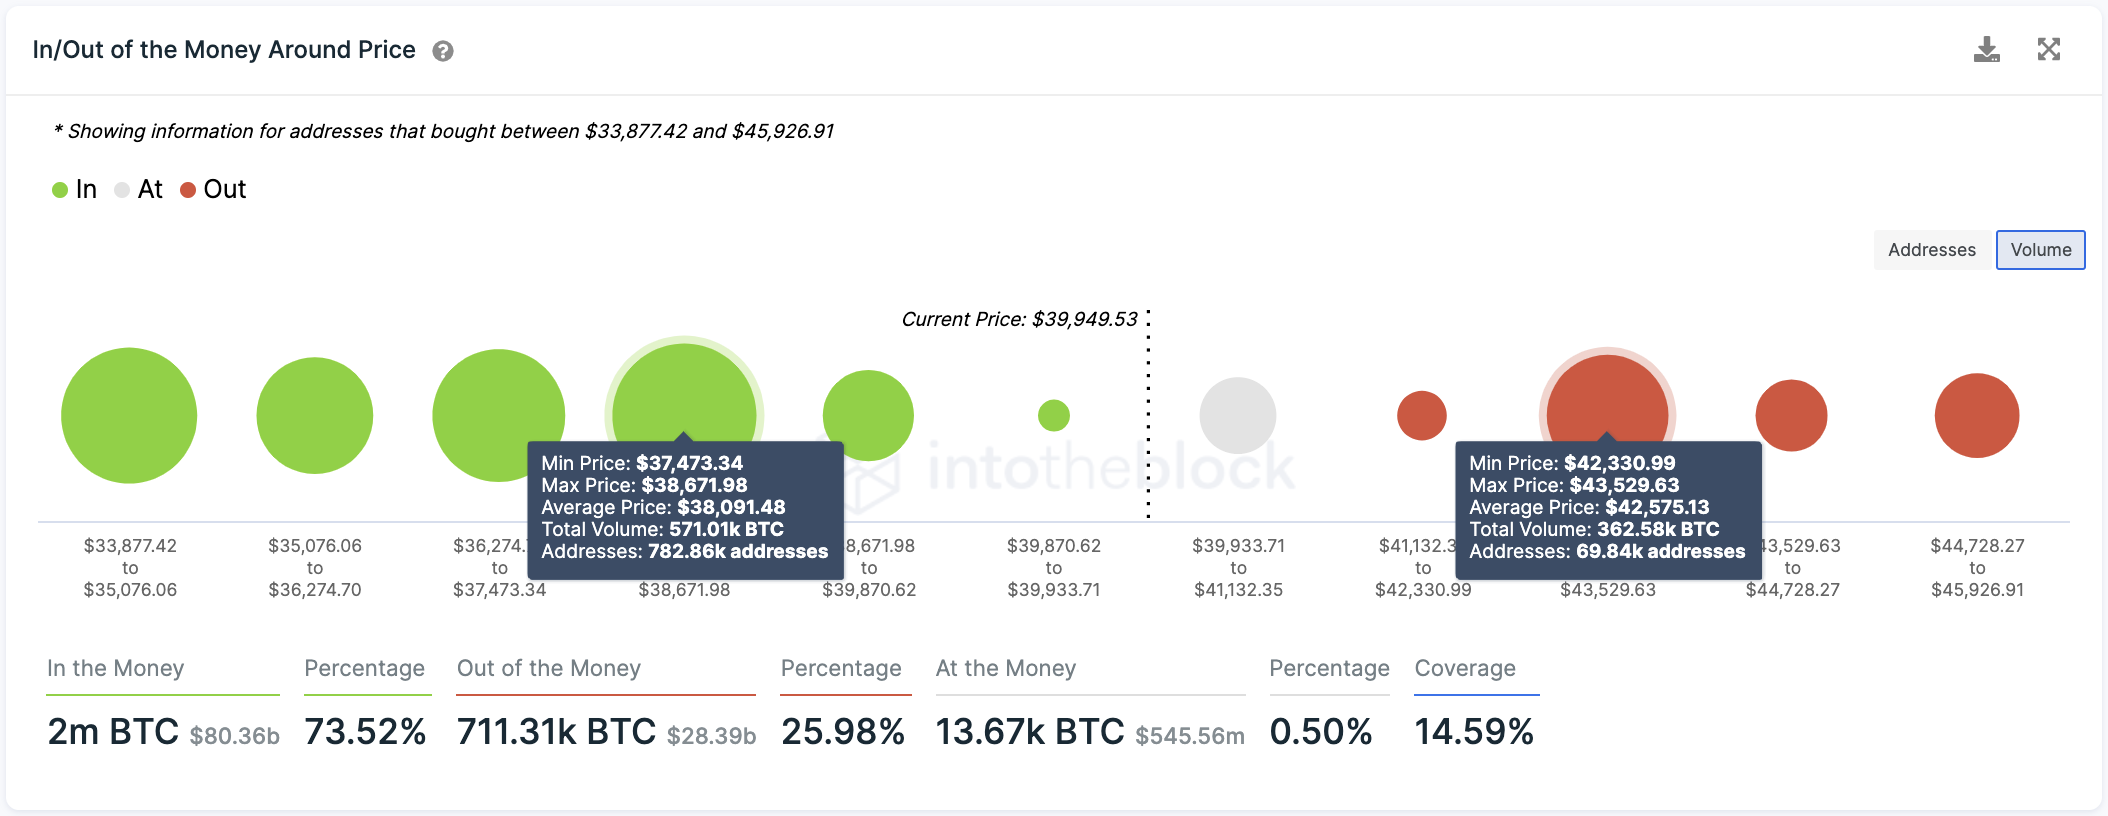
- Despite the pessimistic outlook, transaction history shows BTC faces no resistance until $42,600.
- Likewise, ETH may advance to $2,500 before it retraces towards $2,000.
Bitcoin and Ethereum continue to make higher highs, but one technical indicator suggests that a correction is in the works.
Bitcoin May Pump Before the Dump
Bitcoin and Ethereum may be due for a correction.
Bitcoin has seen its price surge by more than 37% over the last week, going from a low of $29,800 to hit a high of almost $41,000.
The impressive uptrend marked one of the best winning streaks that Bitcoin has experienced since its downturn began in mid-April. The leading cryptocurrency also closed its eighth consecutive green day for the first time since December 2020.
The Tom DeMark (TD) Sequential suggests that Bitcoin is primed to retrace despite the significant gains it has incurred. This technical indicator presented a sell signal in the form of a green nine candlestick on BTC’s daily chart.


The bearish formation is indicative of a correction of one to four daily candlesticks before the uptrend resumes.
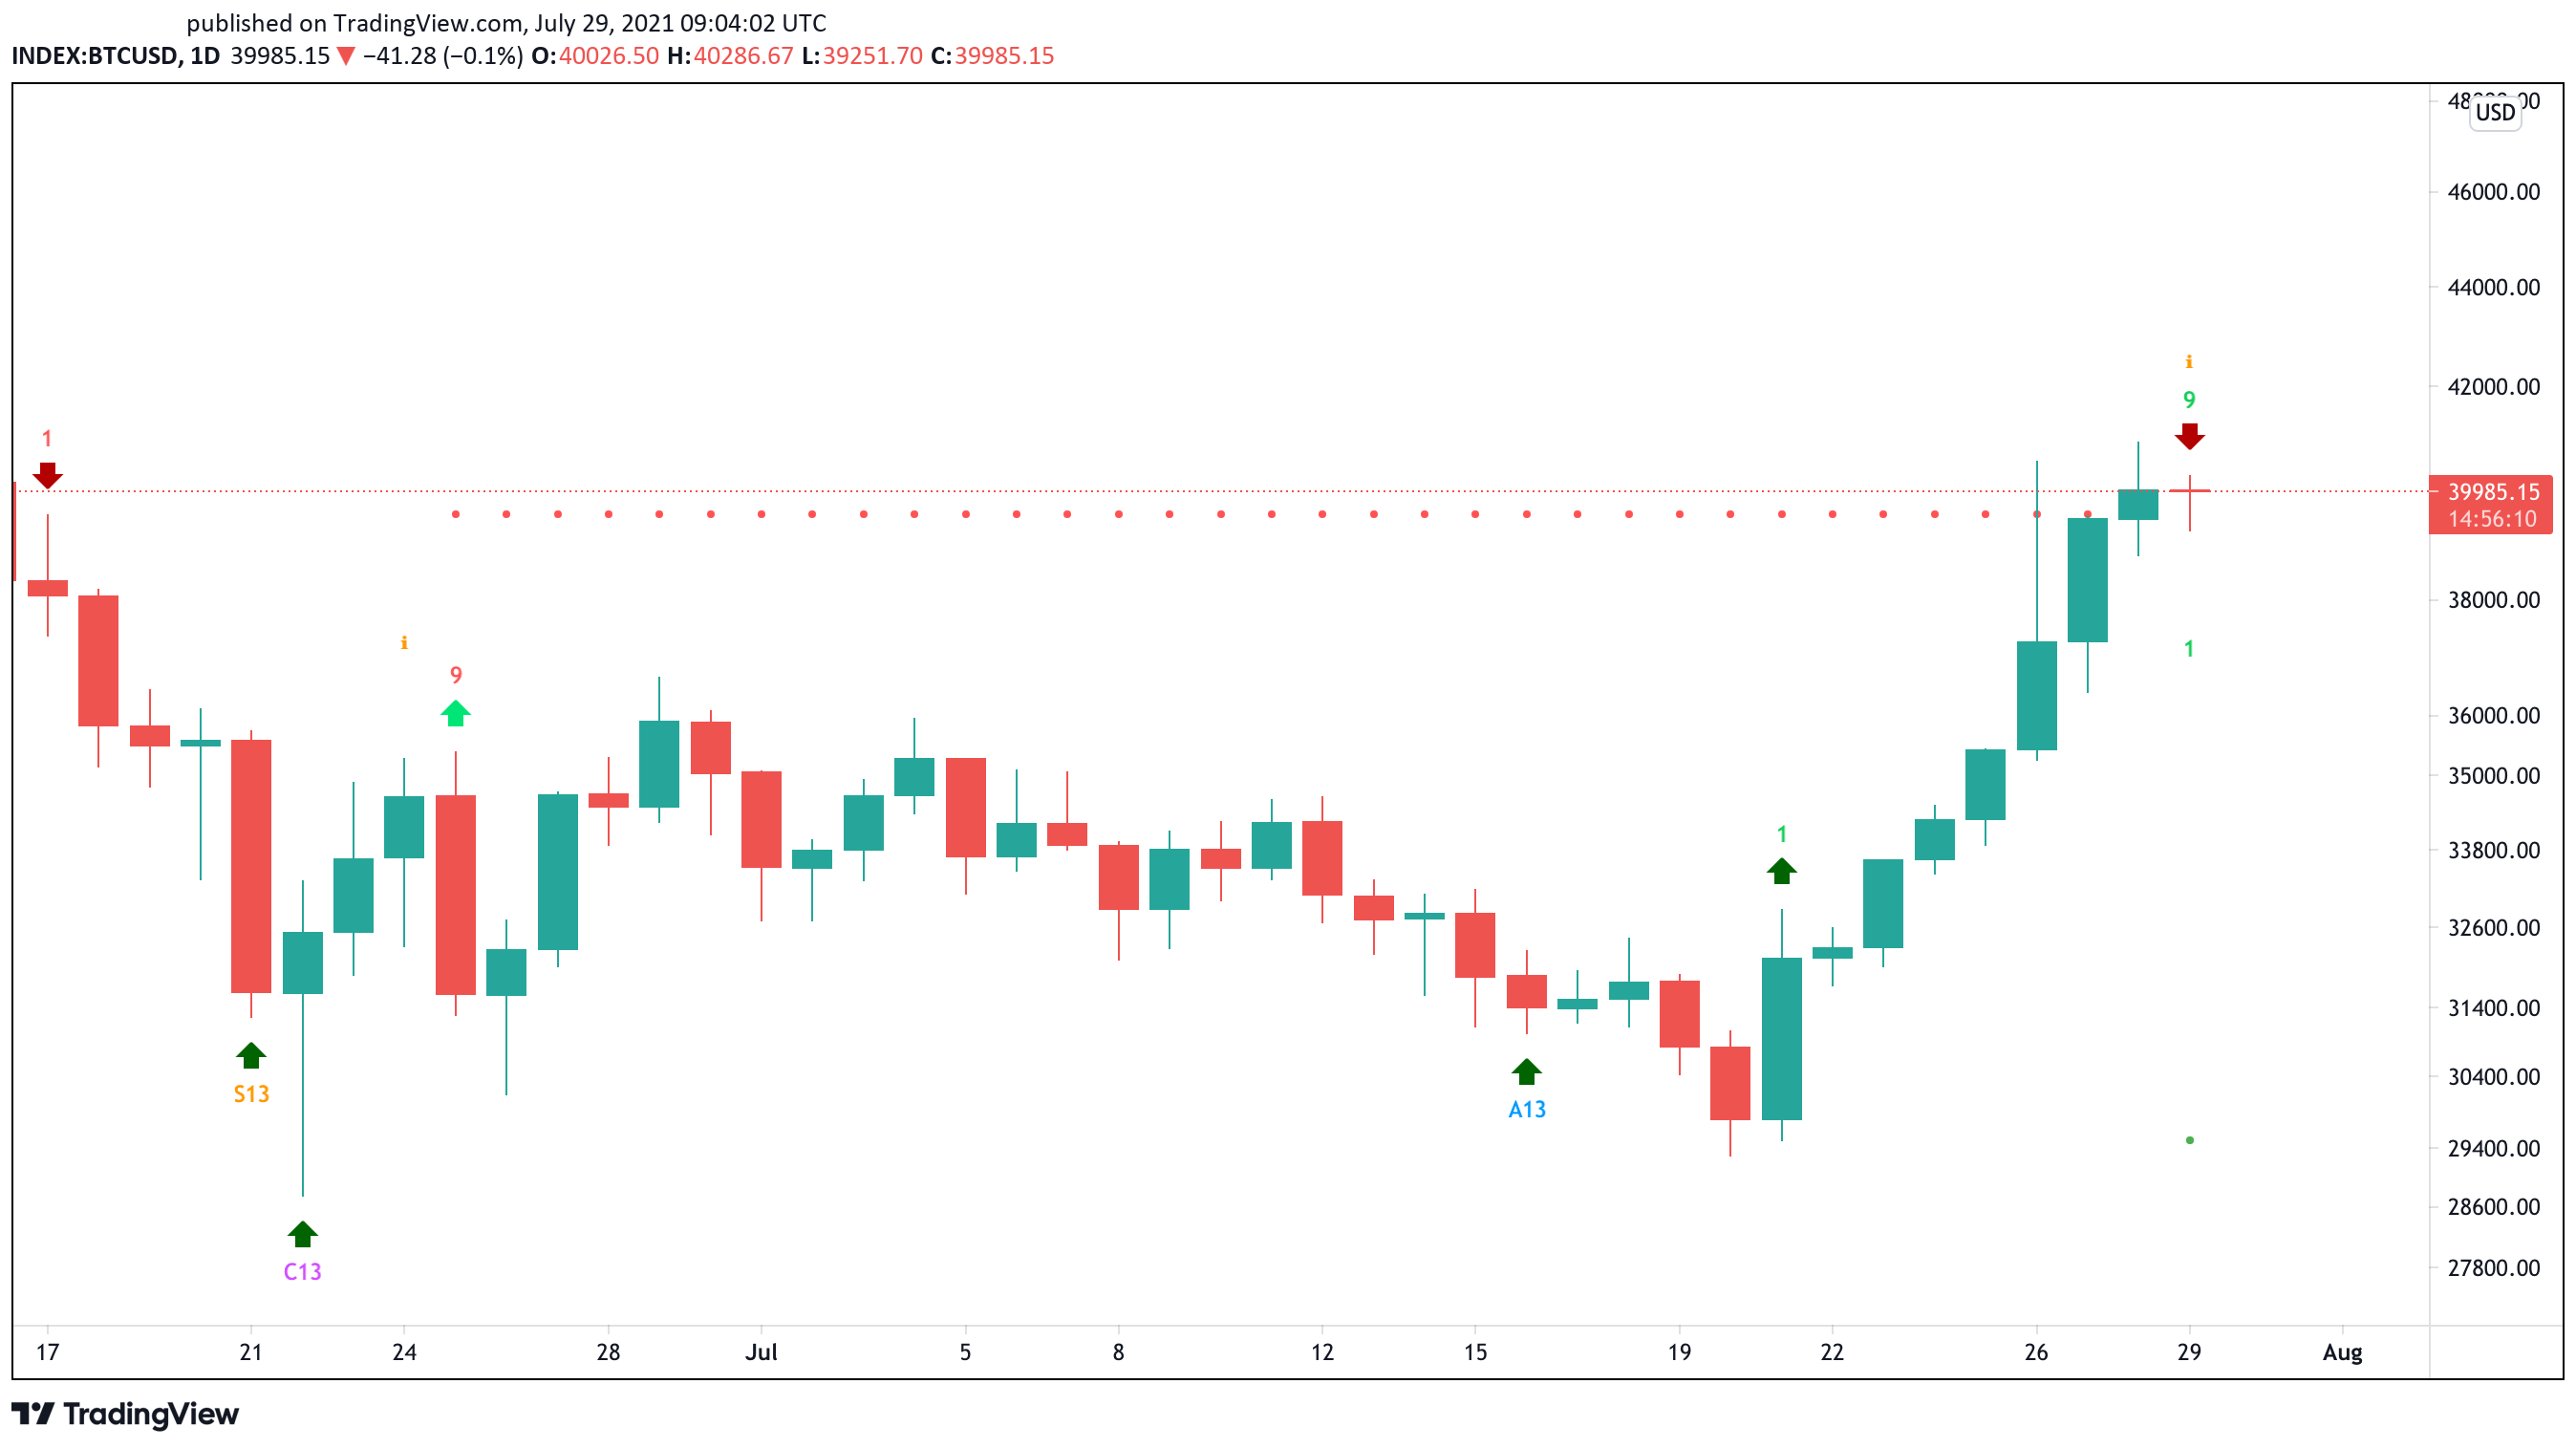
Given the lack of opposition ahead, the flagship cryptocurrency may continue rising toward the $42,330-$43,530 range before the TD’s bearish outlook materializes.
Ethereum Follows the Bitcoin’s Path
Like Bitcoin, Ethereum seems bound for a downswing before it continues posting higher highs. The TD Sequential suggests that ETH is trading at overbought territory after flashing a sell signal in the form of a green nine candlestick on the daily chart.

A spike in selling pressure could see ETH shed some of the 36.5% gains it posted over the last week.
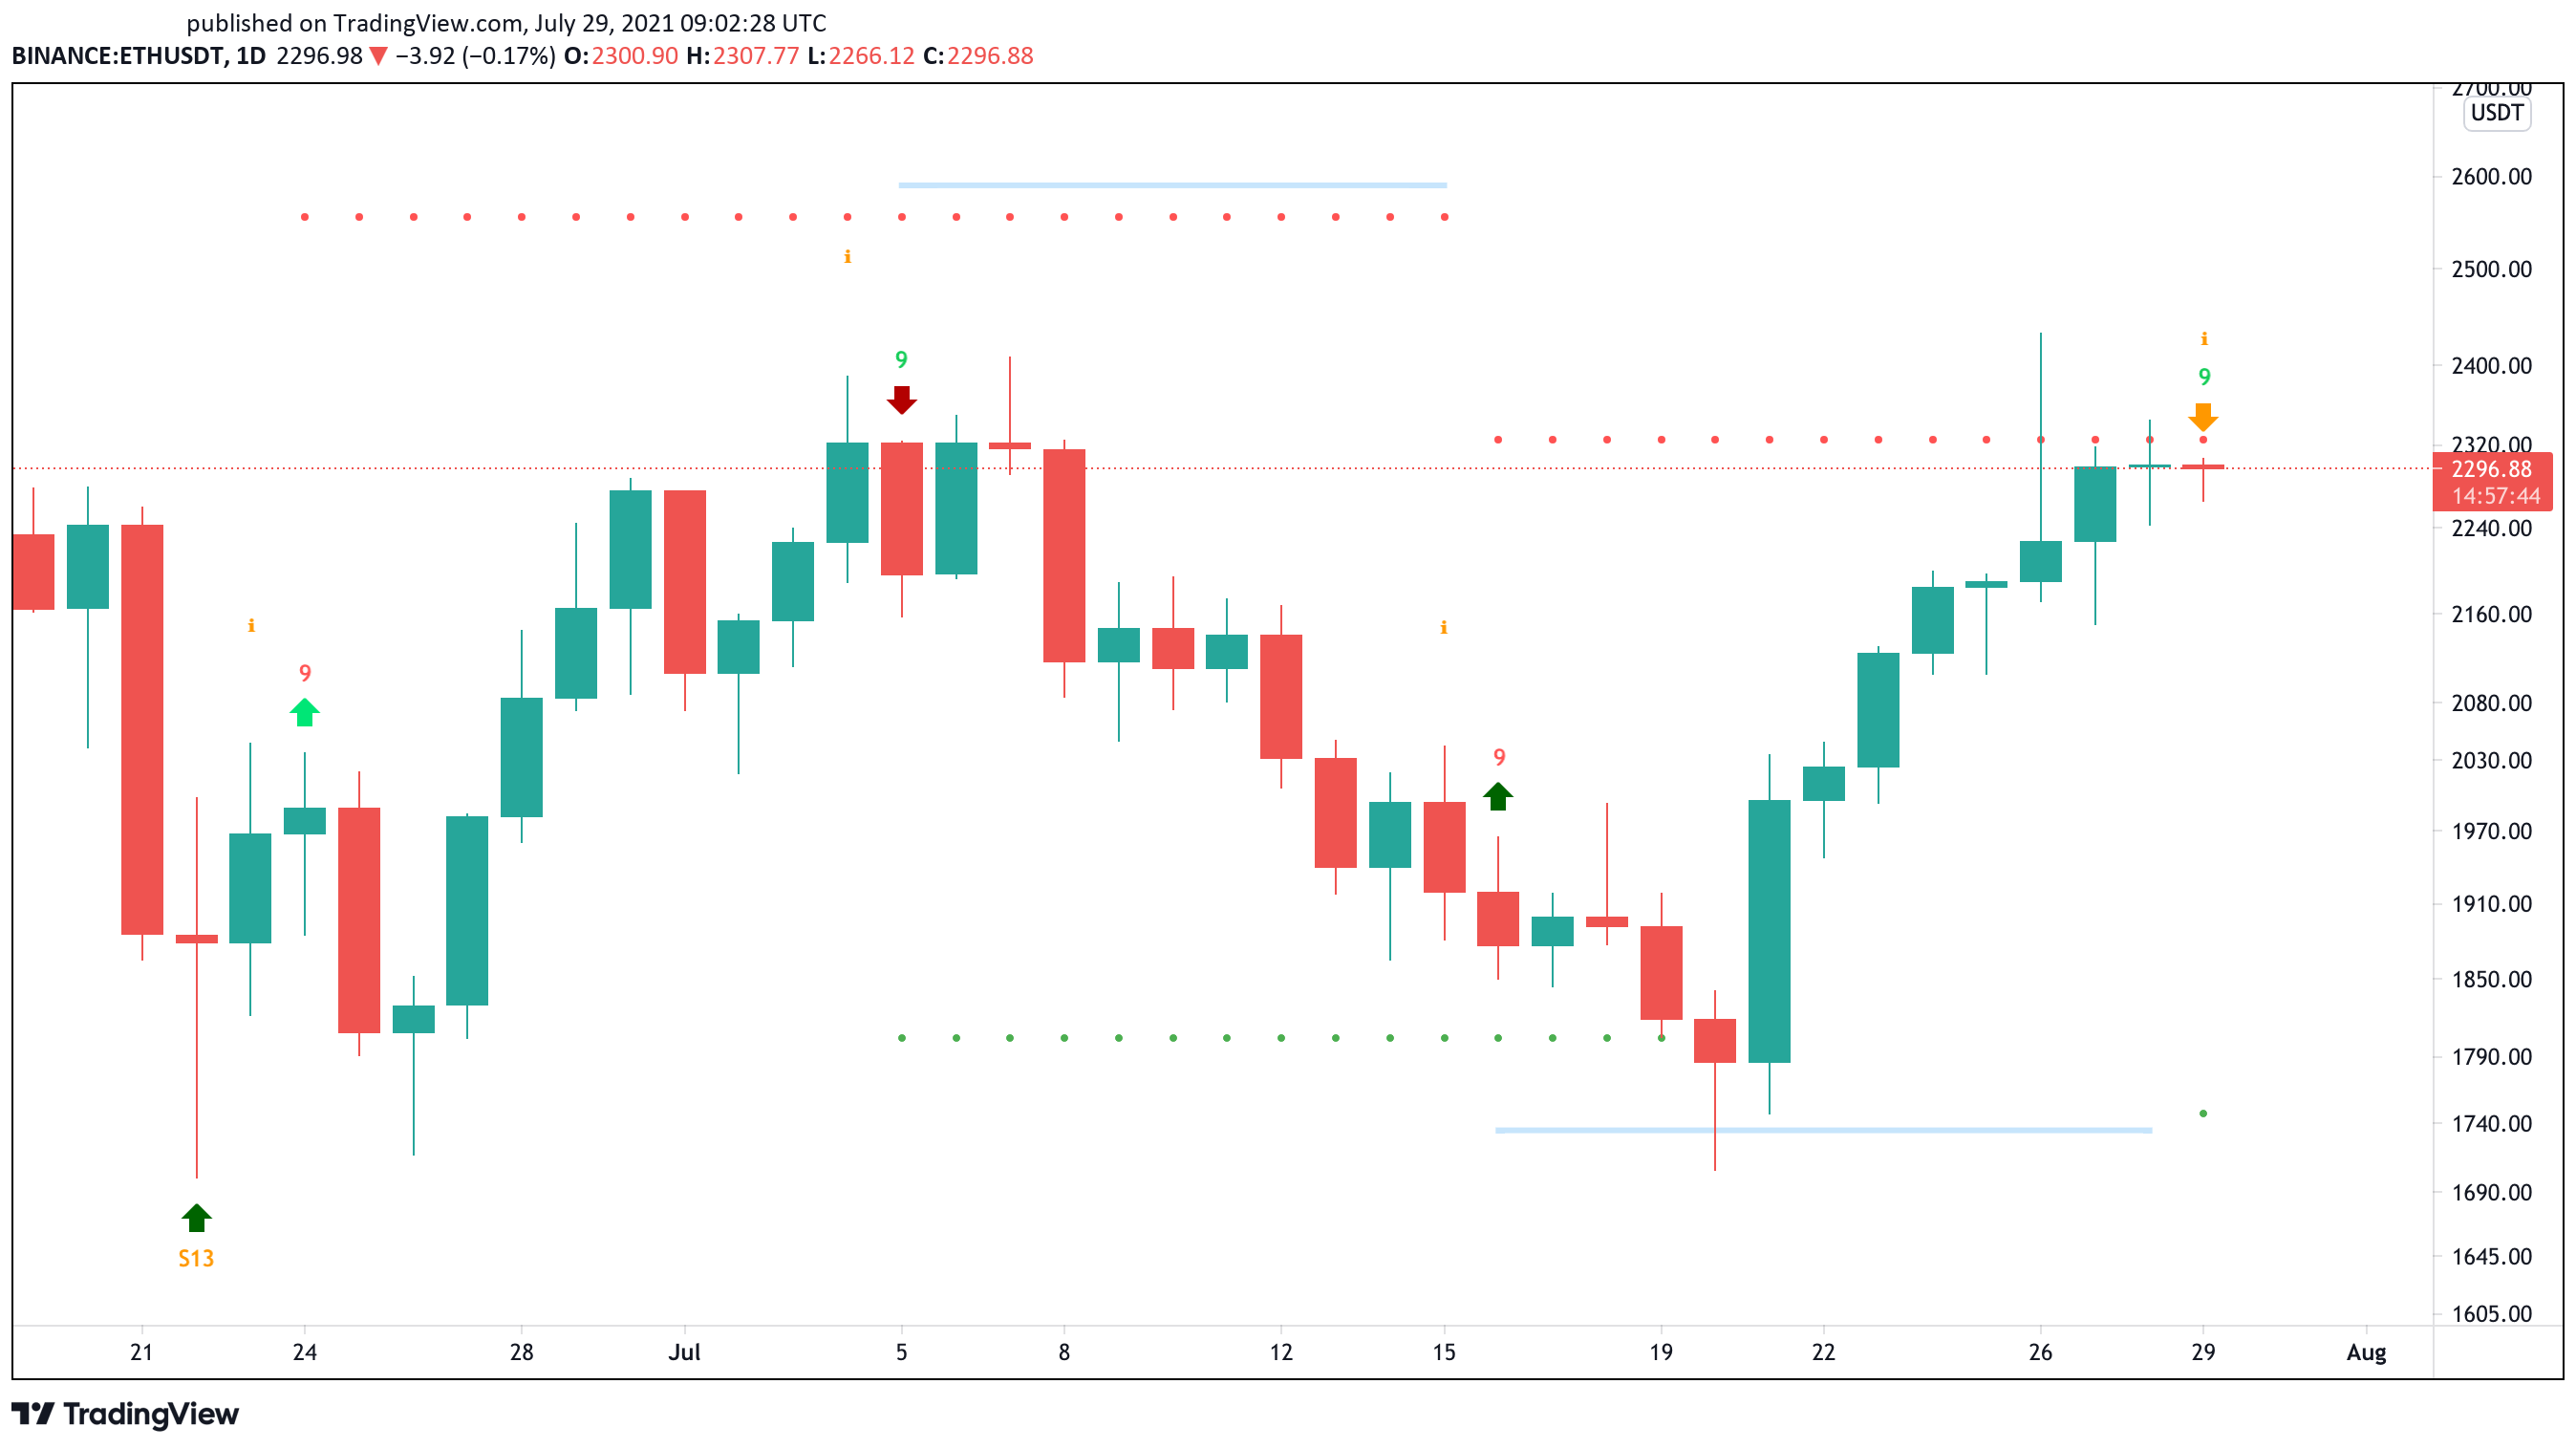
The $1,950 demand wall may have the strength to prevent prices from falling further and serve as a rebound zone for ETH.
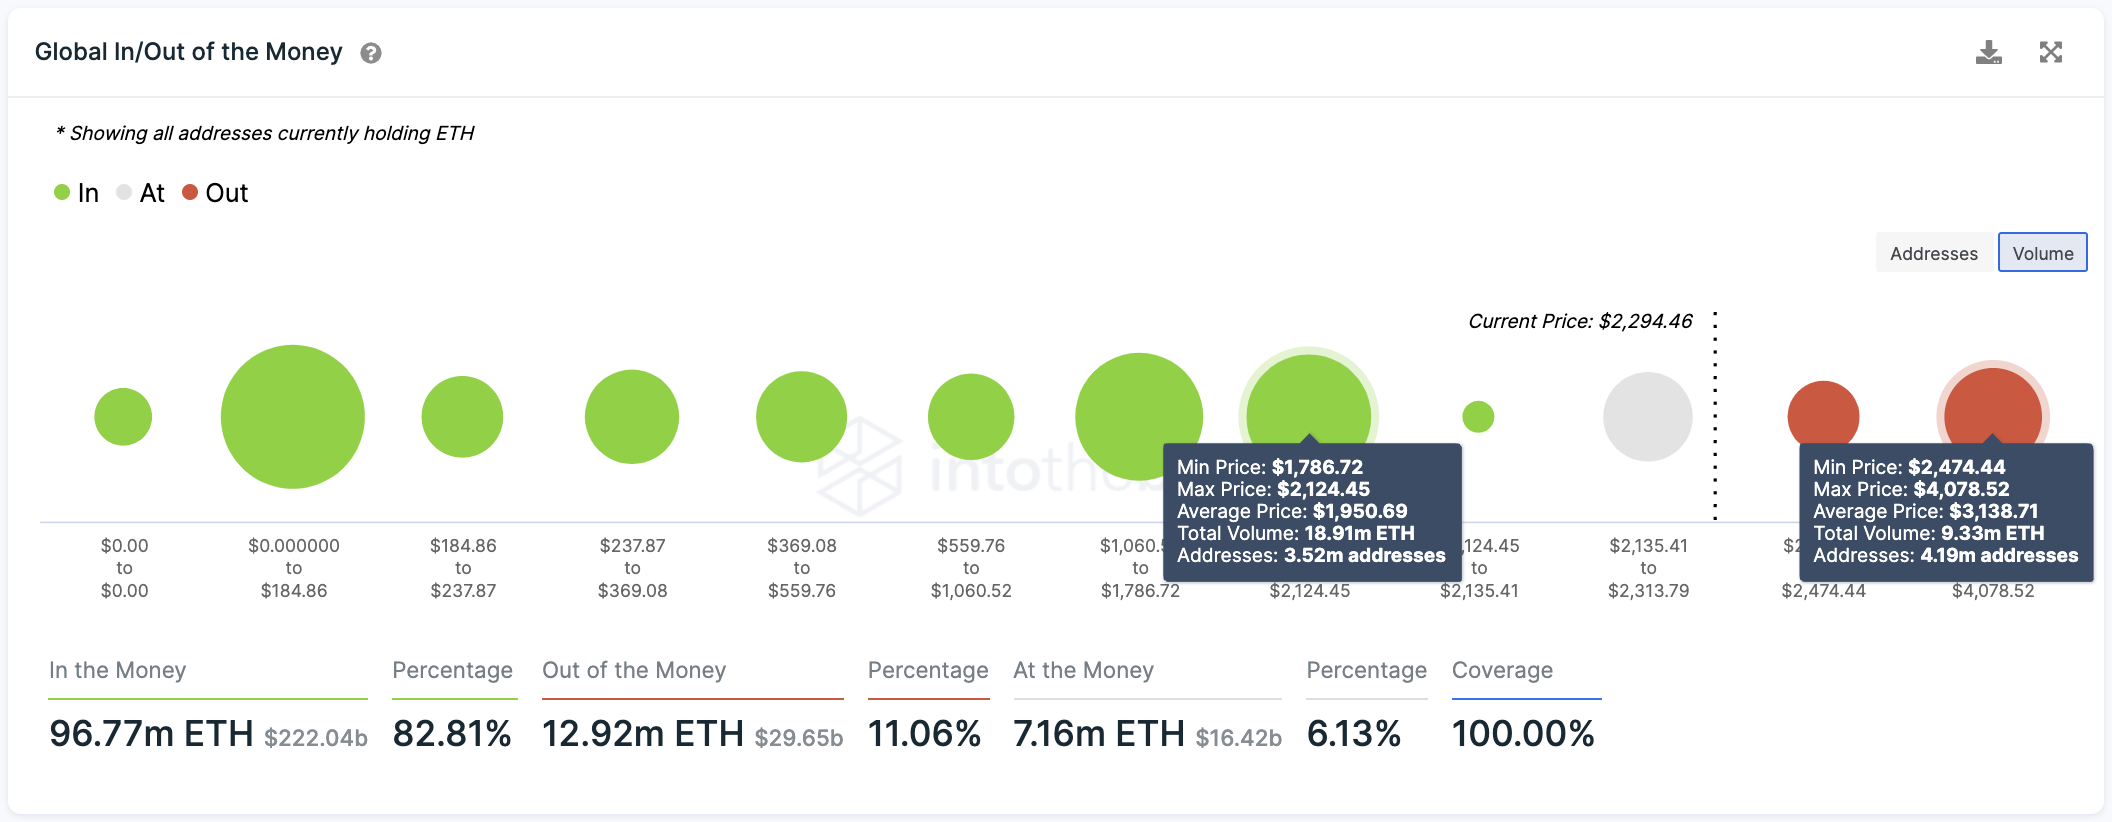
Therefore, ETH is well-positioned to advance toward this level before the TD’s cell signal gets validated. Only a rejection from the overhead resistance is likely to result in a sell-off toward the underlying support that extends from $1,790 to $2,130.