U.S. Durable Goods Orders Rise 3.4% in June, blared the Wall Street Journal headline this morning. As usual, not only is that not the whole story, it’s misleading. It’s wrong. It’s dumb. It raises the question of why the mainstream media adamantly refuses to report the facts. More importantly, why do they ignore the blatantly obvious implications of the actual data? The answer must be that they don’t want us to know. Because it’s ugly.
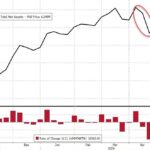
First, this figure is based not on the actual dollar figure, but on a seasonally adjusted figment of statisticians’ imaginations based on an arbitrary, multiple smoothed and filtered moving average that purports to represent what the number would be if it were not for those pesky seasonal swings. This number will be subject to multiple revisions in the months and years ahead until it most accurately fits the actual data. It is an abstraction which, as of the date of the initial release, may or may not come close to reality, and we have no way of knowing whether it does or not, other than to look at the actual data. So why not look at just the actual data, plot it on a chart, and see how it’s doing that way? That’s exactly what we do.
The second problem, aside from seasonal finagling, is that the number is nominal. It does not include the impact of inflation. To get an accurate view of the volume of orders, it’s necessary to adjust for that, which is simple enough to do by applying the Producer Price Index to the current and historical nominal data.
On that basis real durable goods orders rose 16.9% month to month in June. Yes, that’s a whopping, world-beating number. June is usually up. Last year June was up 10.9% and in 2013 it was up 8.3%. Why so much this year? Because May stank. It was down -3.7%, which was far worse than any May over that 10 year period. May is usually an up month. The June gain was simply a matter of delayed orders from May catching up. The total gain of the 2 months was +13.2%. That was still pretty good compared to years past. In 2014, the total gain for the 2 months was +10.6%. In 2013 it was +15.9%, which was the best uptick for that 2 months since 2005.