Our benchmark S&P 500 erased yesterday’s entire -1.01% slump, the worst selloff in 19 sessions, with today’s 1.05% gain. The index, however, is still down 0.30% for the week at the close of the mid-week session. The S&P 500 rallied at the open, gave back some of the gains with the 2 PM ET release of the FOMC’s March minutes but then recovered and resumed its pre-Fed trend. It closed the day fractionally off its 1.08% intraday high shortly before the final bell. The larger influence on today’s equity action was the surge in oil prices in light of the substantial decline in crude inventories. WTI was up over 5% for May futures.
The yield on the 10-year note closed at 1.76%, up three basis points from the previous close.
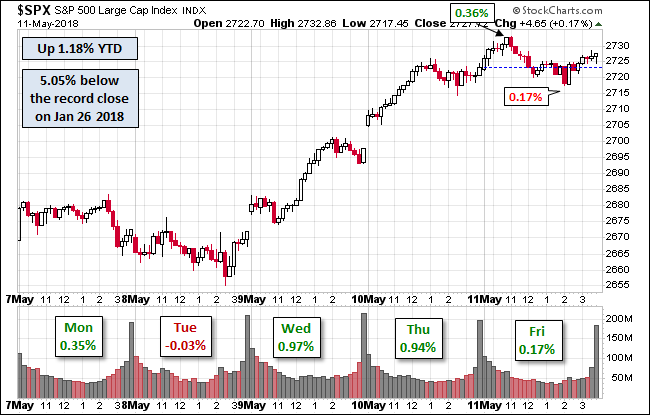
Here is a snapshot of past five sessions in the S&P 500.

Here is a daily chart of the index. Despite the drama of the FOMCE minutes and surge in crude futures, volume was light. The market’s lull may soon be broken as we shift to Q1 earnings next week.

A Perspective on Drawdowns
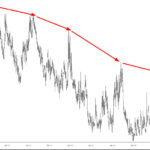
Here’s a snapshot of selloffs since the 2009 trough.
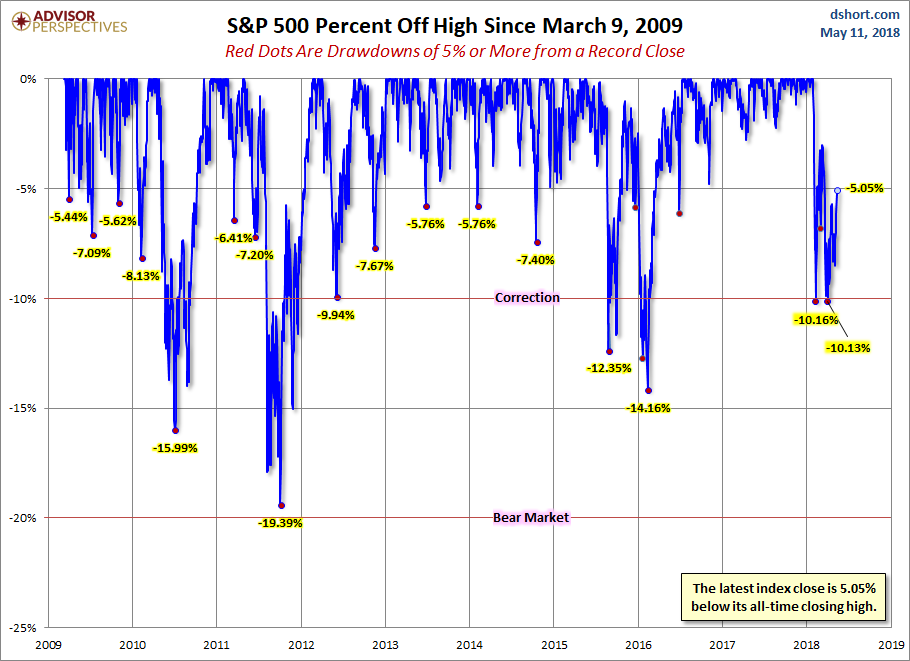
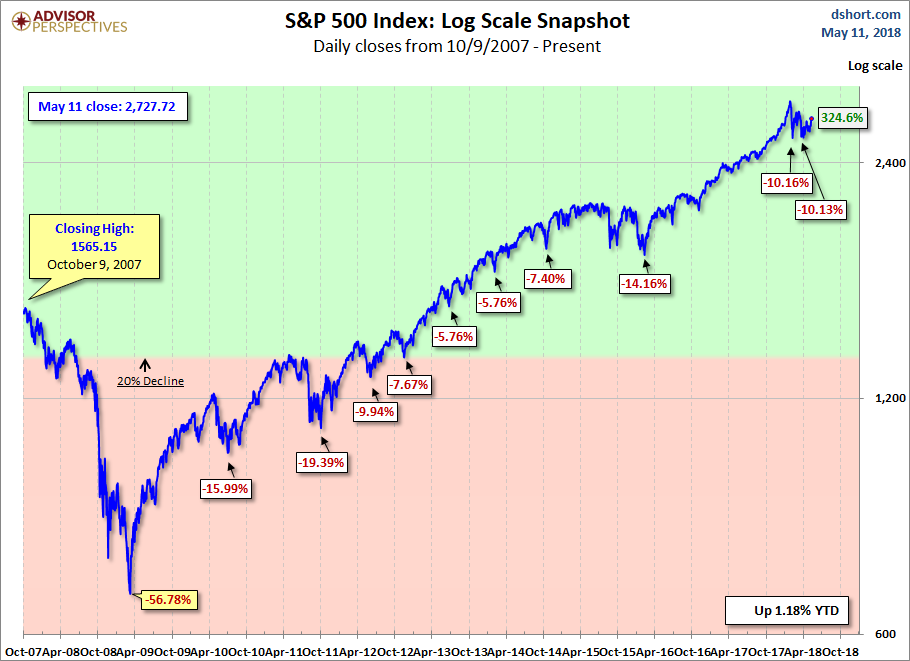
Here is a more conventional log-scale chart with drawdowns highlighted.
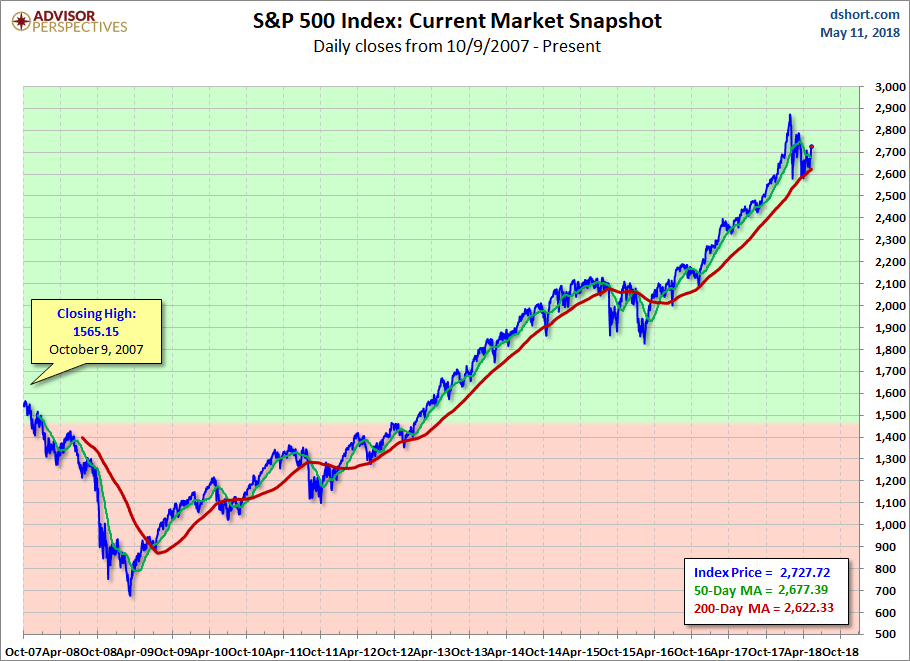
Here is a linear scale version of the same chart with the 50- and 200-day moving averages.
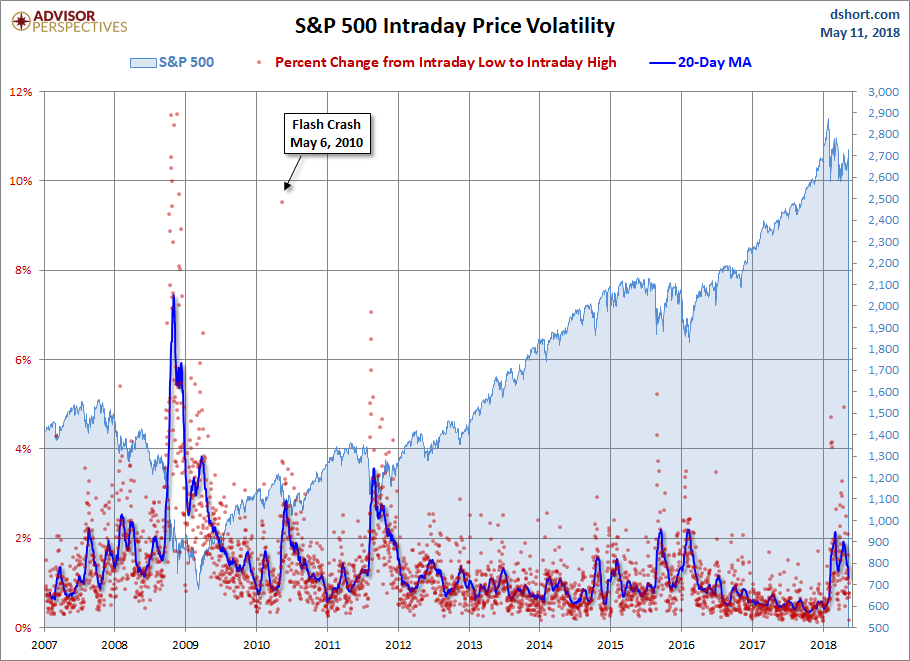
A Perspective on Volatility
For a sense of the correlation between the closing price and intraday volatility, the chart below overlays the S&P 500 since 2007 with the intraday price range. We’ve also included a 20-day moving average to help identify trends in volatility.