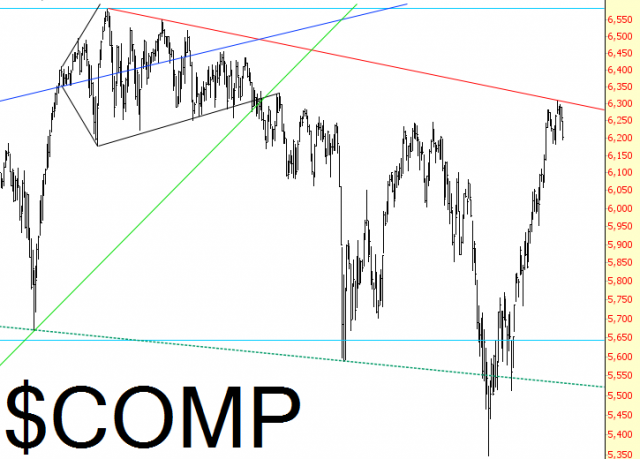
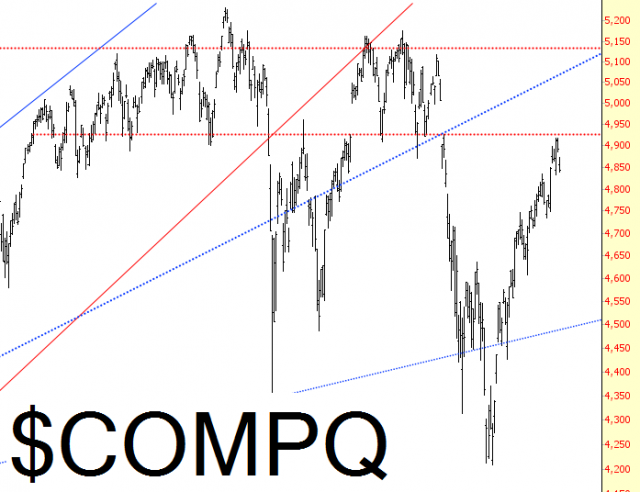
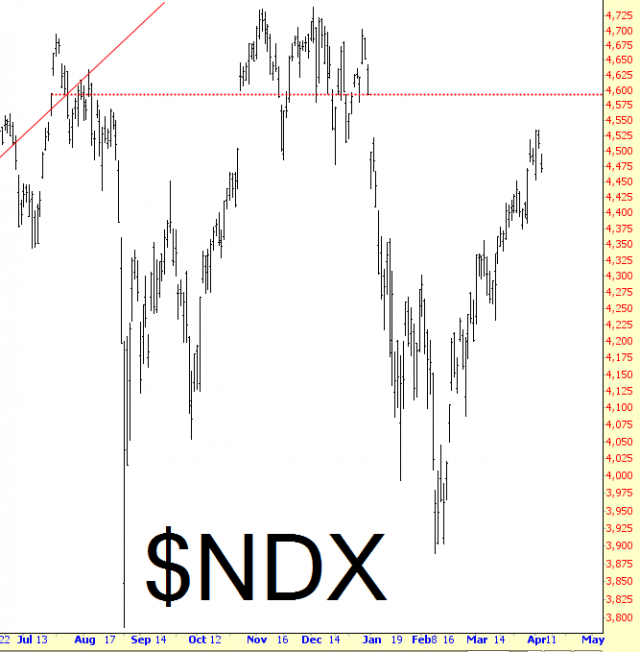
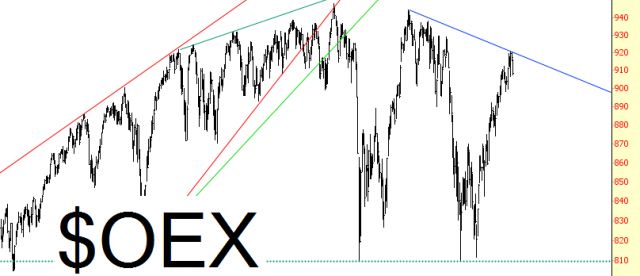
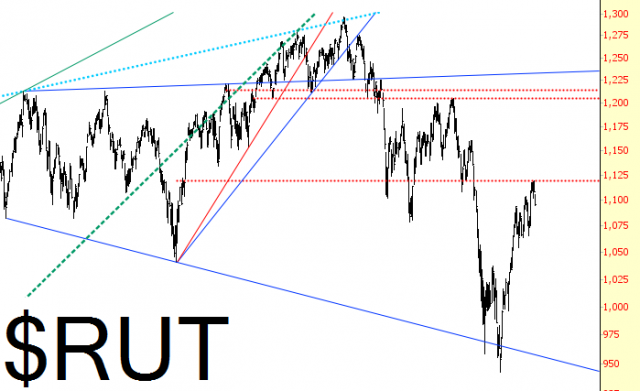
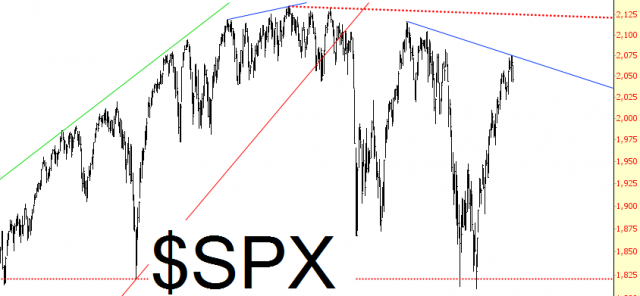
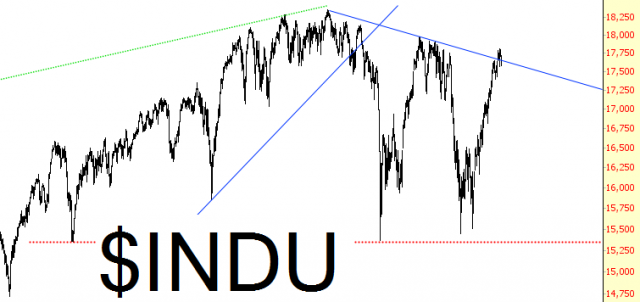
This post was intended to show a bunch of index charts and divide them into “solid” (those with solidly bearish patterns, in spite of the absolutely ludicrous and brain-dead rally from February 11 through April 1) and “shaky’ patterns. It turns out that I’ve only got one ‘shaky” chart to offer, which is the Dow 30, since it violated its trendline and has been monkeying around that level for about a week now.
The other indexes, however, are still in excellent shape. Yes, there may be some short-lived strength in the next day or two, to help digest the drop the market has endured over a horrible, Yellen-panic-worthy two day long bear market, but on the whole, it looks like the U.S.S. Misery is pulling up to dock, and it’s “All Aboard!” for the bulls.