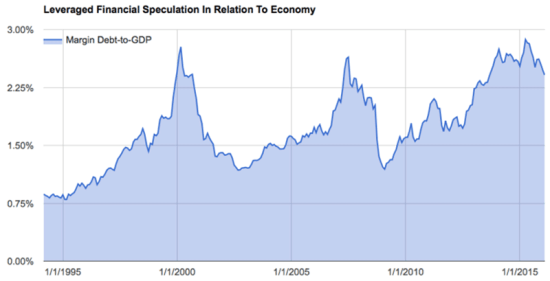
A recent article in Business Insider by Jesse Felder from TheFelderReport.com raised a loud alarm bell over rising margin debt levels in the U.S. stock market (see “A closely followed indicator says a 20% drop in stocks could be coming soon“). The article used the following chart as part of an analysis concluding that a massive bear market is right around the corner – specifically a correction of 20% in the S&P 500 (SPY) should occur “sometime soon”:

Massive run-ups in margin debt have coincided with the last two major market tops.
Source: Business Insider
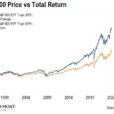
This chart is VERY suggestive, but I see two immediate problems: 1) a very small sample size (n=2), and 2) the nature of the latest run-up is much different than the last two. The article tries to address #1 by building a model of projected 3-year returns based on the margin debt to GDP ratio.

According to the Business Insider article, this model suggests that as of February the 3-year return on the S&P 500 going forward should be around 35%.
Source: Business Insider
I see two major problems with this model.
First, why just use and provide the 3-year return? Did this projection fortuitously work the best out of 100 other attempted time periods? How good is the idea on those other time periods? It is VERY possible that just by pure random luck, THIS is the one time period that provided the best fit. I would have more confidence in this model if the concept worked over multiple forecast periods.
Second, even with a good reason to believe in the robustness of this model choice, I see periods of MAJOR model failure that give me pause. See in particular (approximately), 1995 to 1997, 2006, and, interestingly enough, the entire post-recession period! A quick glance tells the eyes that the model seems to capture the general trend and contours of actual performance, but a closer examination quickly reveals very large errors between actual and forecast performance. In fact, seeing these errors convinces me that this 3-year projection was indeed chosen as one of numerous potential models that just happened to (meaning coincidentally) have the “least bad” errors.