So it was the biggest bounce in stocks since 1933, and best quarter for gold since the 70’s. None of this should surprise you based on what’s going on out there (think all forms of debasement), but for us the most important observation is gold has signaled it’s ready to start its next leg higher. Silver should still have you wondering, which is of course what the establishment wants. When you see silver go through $20 though, it will run to $50 quickly. And if it makes it through $50, which means bullion buyers will have to chew through JPMorgan’s (the government’s) entire hoard (if it exists), it will be at $400 quickly as well, matching the bull move of the 70’s coming out of its mid-cycle correction. We expect to see these trajectories in the 2021 area, a Fibonacci 21-years from the year 2000 turn.
Just to be clear then, what we got in the first quarter was a buy signal in gold, the shares, and key ratios; highly suggestive the bull market is back on. All we need is for silver to join the party in this regard, and we are off to the races. Further to this, and unfortunately for everybody, it appears this buy signal is not a result of political instability, or the threat of war, or any other result of the general state of debasement the ‘powers that be’ subject us to, but the result of anticipated currency debasement, the old standard. That’s the only conclusion one can to given the pictures (charts) below. That’s what we are going to do this week – go through these six charts because they confirm this thinking. The delayed positive reaction in the equity complex to Yellen’s comments Tuesday was the tell, boosted by the insanity over at the ECB as well.
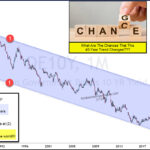
Yup – the ECB is talking ‘QE for the people’ with the economy grinding to a halt, and the Fed won’t be too far behind is the message we got from gold in the first quarter – even if we are only in the first inning of the move. And the thing is, we are getting confirmation of this thinking in the charts, where for example, the S&P 500 (SPX) has turned bullish on all accounts, even the monthly plot with a higher high finish in March. (see below) What’s more, and as can be seen on the monthly plot below, although RSI will most likely generate a negative divergence in the indicators set against new highs (now likely), the message is still bearish, a ‘topping process’ if you will – even if the SPX is able to surge to the Fibonacci resonance related target in the proximity of 2450. Such an outcome would shock a great many traders, finally curbing their desires to hedge every advance in stocks. (See Figure 1)
Figure 1 – Click Chart For Sharper Image
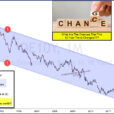
Because authorities have to do something dramatic with stagflation creeping into the economy and the election only months away now. It’s not like the old days, where the Fed would remain neutral. Now, with guys like Trump and Sanders threatening to defrock the Fed, they have become very biased bureaucrats fearing for their jobs. This is very important to understand because many either don’t, or chose not to believe it, which could be expensive if they are short stocks. Again, this is confirmed in the monthly SPX / CBOE Volatility Index (VIX) Ratio plot seen below, where as with the above, here again we had a higher monthly close, the indicators appear constructive, and the stochastics have turned higher. As unlikely as such an outcome may appear, and although the move can fail at any time, short sellers should be very cautious here at this ratio appears set to vex the sinusoidal again. (See Figure 2)