EUR/USD
4 hour

The EUR/USD is in a downtrend after completing wave e (green) of wave 4 (blue). Price is still above the support levels (green) from the daily chart bottoms, which could act as potential bouncing spots. A break above resistance (red) trend line could start the wave 2 (green) correction whereas a break below the most recent bottom could see price extend wave 1 (green).
1 hour

The EUR/USD could start an ABC zigzag (brown) correction within wave 2 (green) if price manages to break above resistance (red). The wave 2 (green) is invalidated if price breaks above the 100% Fibonacci level. A break below the wave b (brown) bottom could see price extend towards the Fib targets of wave 5 vs 1+3.
GBP/USD
4 hour

The GBP/USD seems to be developing a bearish wave 1 and 2 (blue). A downtrend continuation is possible if price pushes below support (green) for a wave 5 (green/blue/purple) whereas the wave 2 (blue) is invalidated once price breaks above the 100% Fib level of wave 2 vs 1.
1 hour

The GBP/USD seems to be in a bullish zigzag (orange) within wave 2 (blue), which would be invalidated if price breaks above the 100% Fibonacci level. A break above resistance (red) could see the zigzag retrace deeper. A break below the support trend line (green) could see the Cable fall for a wave 3 (blue).
USD/JPY
4 hour
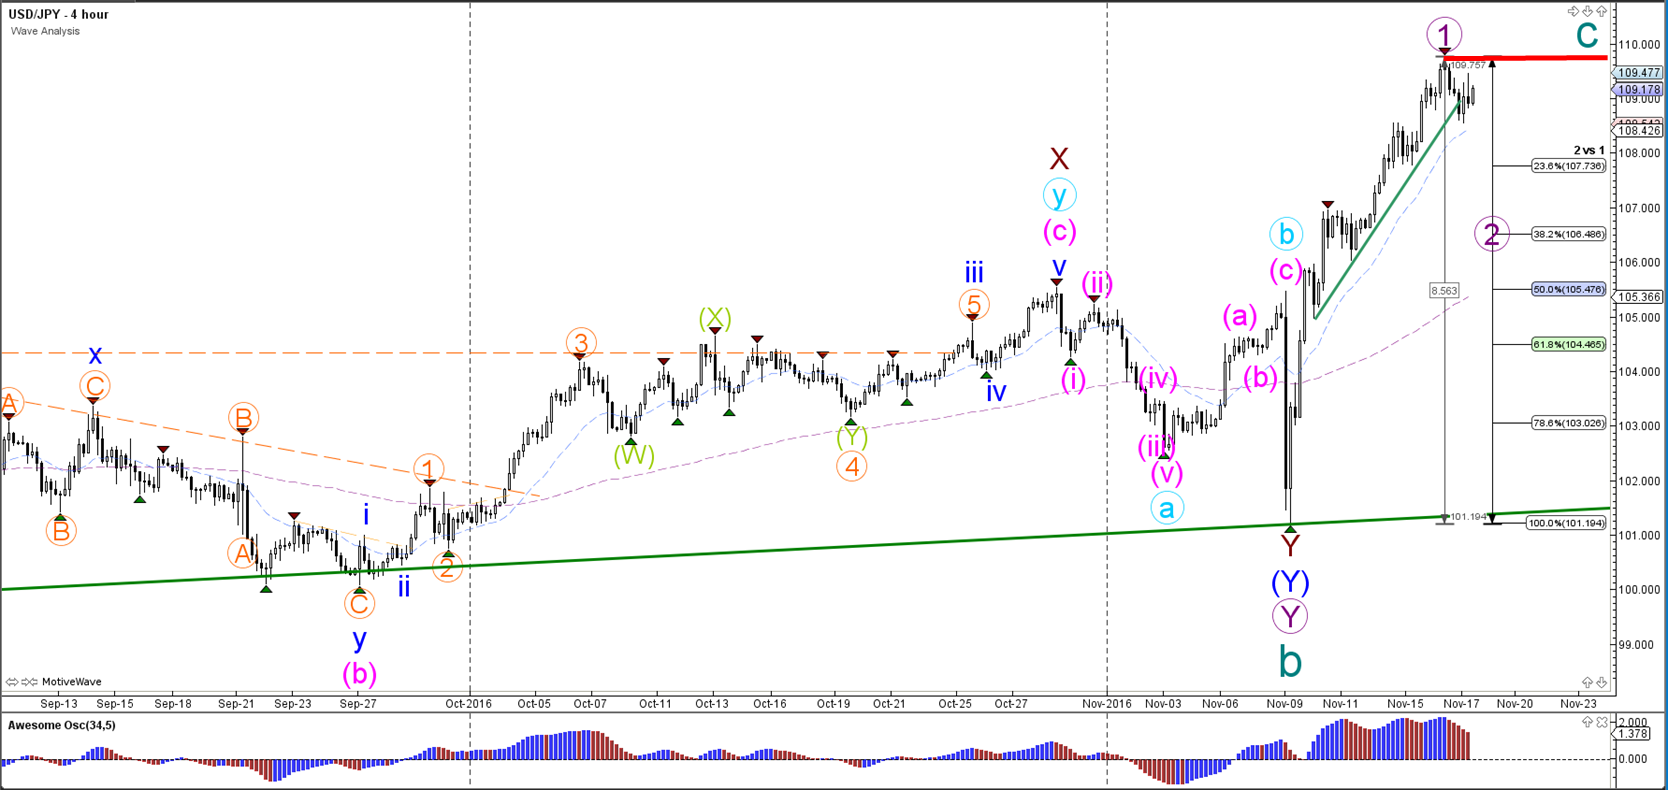
The USD/JPY is displaying strong bullish momentum, which has been labelled as a wave 1 (purple). If price breaks above the previous top (red) and psychological 110 level, then a different wave count is more probable: an impulsive wave 3 rather than a wave 1 (purple).
1 hour

The USD/JPY uptrend stopped near the 110 resistance. This could be a retracement within wave 2 (purple) if price breaks below support (green).