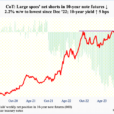
Most people who teach economics are on a continual lookout for current examples of supply and demand. Otherwise, you end up falling back on hypothetical goods like “widgets” and “leets” (which is “steel” spelled backward), at which point you can almost see the life and brightness fade out of the eyes of students. nice lively example of shifts in demand comes from the demand for sand used in hydraulic fracking operations. As the Wall Street Journal recently reported, “Latest Threat to U.S. Oil Drillers: The Rocketing Price of Sand: The market for a key ingredient in fracking is again surging,”
(by Christopher M. Matthews and Erin Ailworth, March 23, 2017).
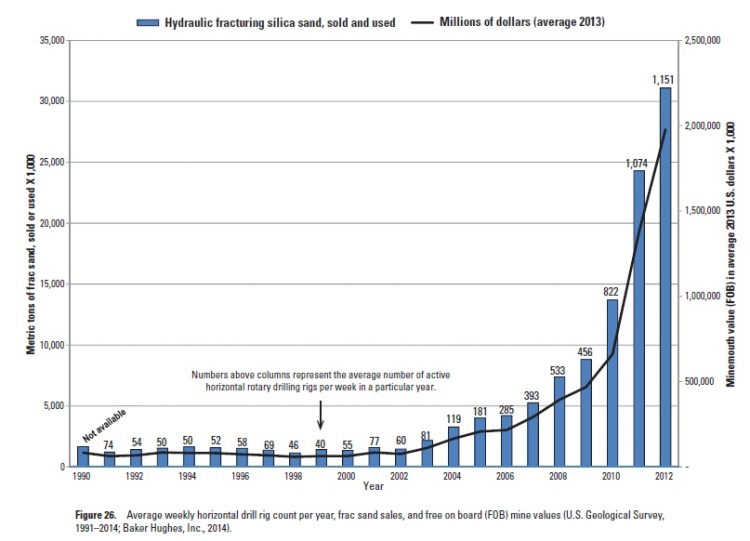
A couple of years ago, the USGS published “Frac Sand in the United States—A Geological and Industry Overview,” by Mary Ellen Benson and Anna B. Wilson, with a section on “Frac Sand Consumption History” contributed by Donald I. Bleiwas (Open File Report 2015-1107, posted July 30, 2015). The report includes this useful figure, in which the bars show the metric tons of sand used for fracking (measured on the left axis); the numbers above the bars show the number of horizontal drilling rigs in operation in the US during any given week of the year; and the line shows the value of the sand (right axis).

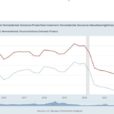
The basic lesson is fracking is up and it is using a lot more sand. If you look a little more closely at teh years from 2010 to 2012, you can see that the number of horizontal drilling rigs rose from 822 to 1,151, but the quantity of sand being used more than doubled. This data can be updated a bit. According to the Baker Hughes North American Rotary Rig Count, the number of horizontal rigs dropped in 2015 and stayed fairly at this lower level in 2016, as the price of oil dropped, but more recently the number of horizontal rigs is rising again.