Written by Sentieo
The CBOE Vix Index is a popular measure of the implied volatility of the S&P 500 index options, calculated and published by the Chicago Board Options Exchange.
The Sky – Is It Falling?
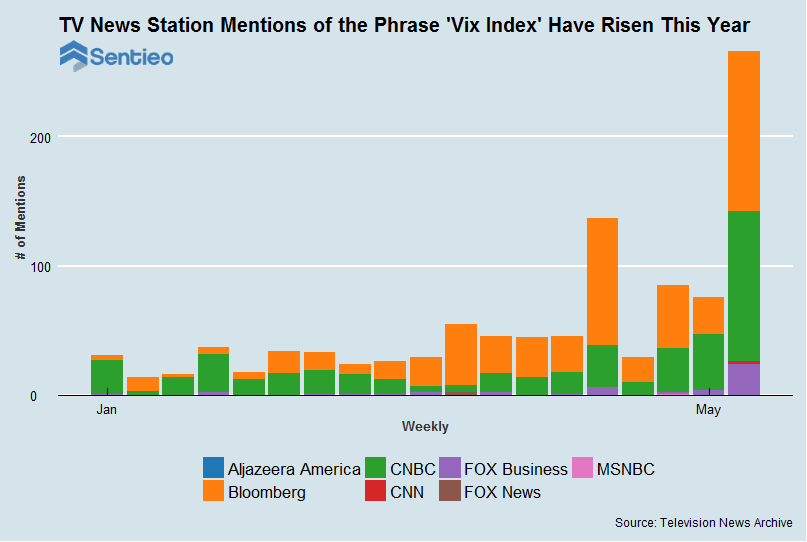
If you watch major business news channels, you may have recently heard that the last time the VIX fell to its current low coincided with the beginning of the Great Financial Crisis of 2007-2008 began. It’s a sensational story line.
Shown below is a chart from the Sentieo platform with the S&P 500 Index (^GSPC) in light blue and the VIX Index in black. The chart shows that the VIX has recently moved down to levels not seen since right before the financial crisis in 2008. At the same time, the broad stock market appears unconcerned.
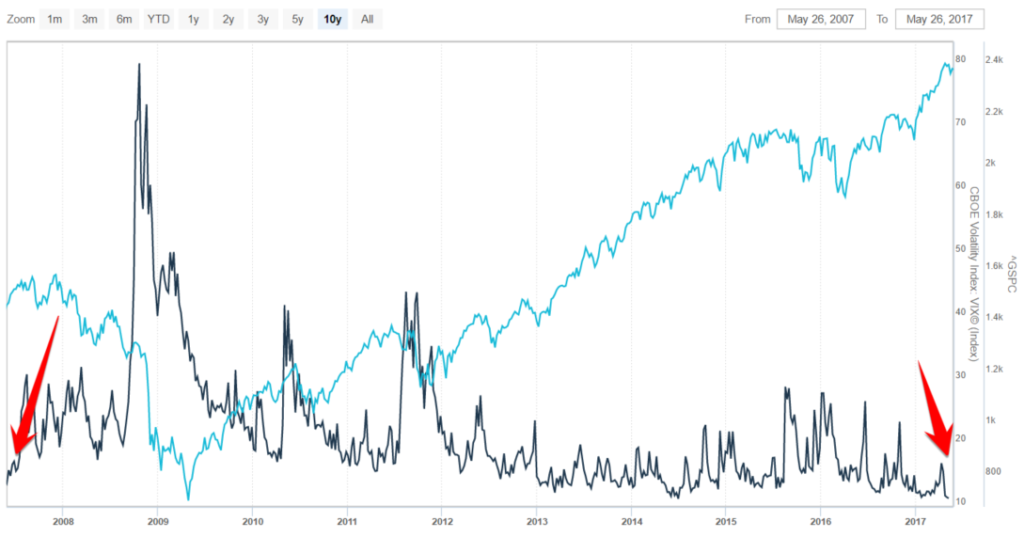
It’s a sobering historical comparison and, based on this data point alone, one might think that the S&P 500 Index is on the brink of sailing right back into the Bermuda Triangle of finance.
But does television chatter of a potential stock market selloff – premised solely on exceptionally low volatility – square with reality?