Bubbles come and go.
Silver and gold – 1980
Japanese Nikkei – 1990
Nasdaq – 2000
Mortgages and Real Estate – 2006
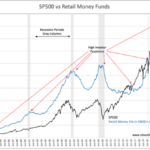
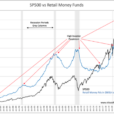
Bonds, Debt, Stocks, Real Estate – 2017
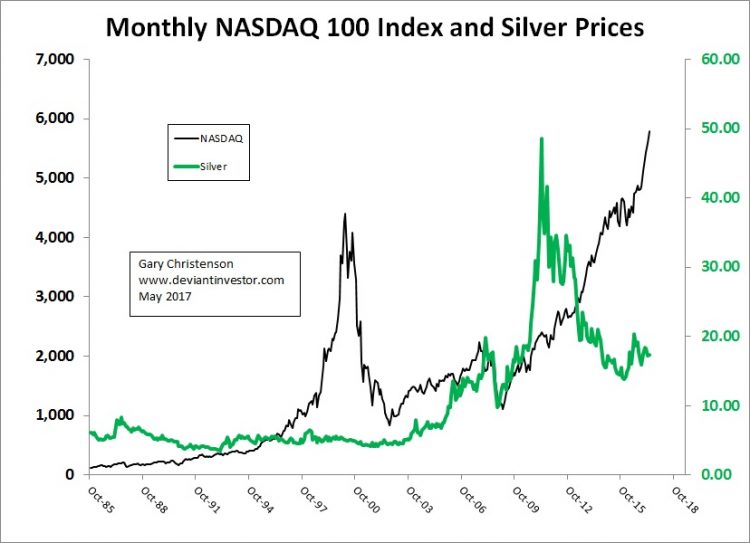
Examine the following graph of monthly data for 32 years of the Nasdaq 100 Index and Silver.
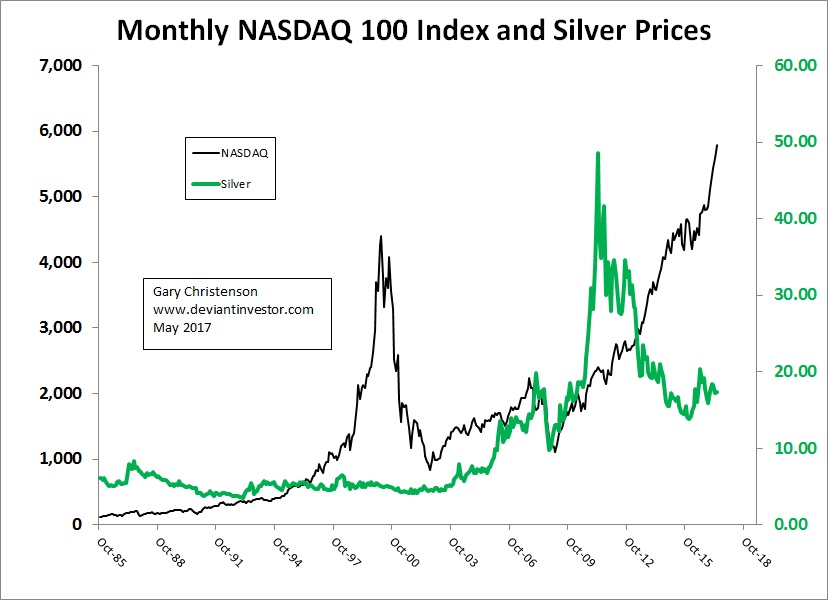
We saw the Nasdaq bubble in 1999-2000, a rapid rise for silver in 2010 – 2011 and a large rise in the Nasdaq 100 during 2009 – 2017.
Prices for both markets have often risen too far and too fast, and then corrected or crashed. The Nasdaq dropped more than 80% from 2000 to 2002. Silver dropped about 70% from 2011 to late 2015.
The Nasdaq 100 is likely to drop by a large percentage following its current run-up. Stay tuned – no correction yet.
Prices for stocks and silver rise, primarily because of currency devaluations. The two markets often offset each other, which suggests we should look at their sum. Examine 32 years of the Nasdaq 100 plus 175 times silver prices, which gives both markets roughly equal weight.
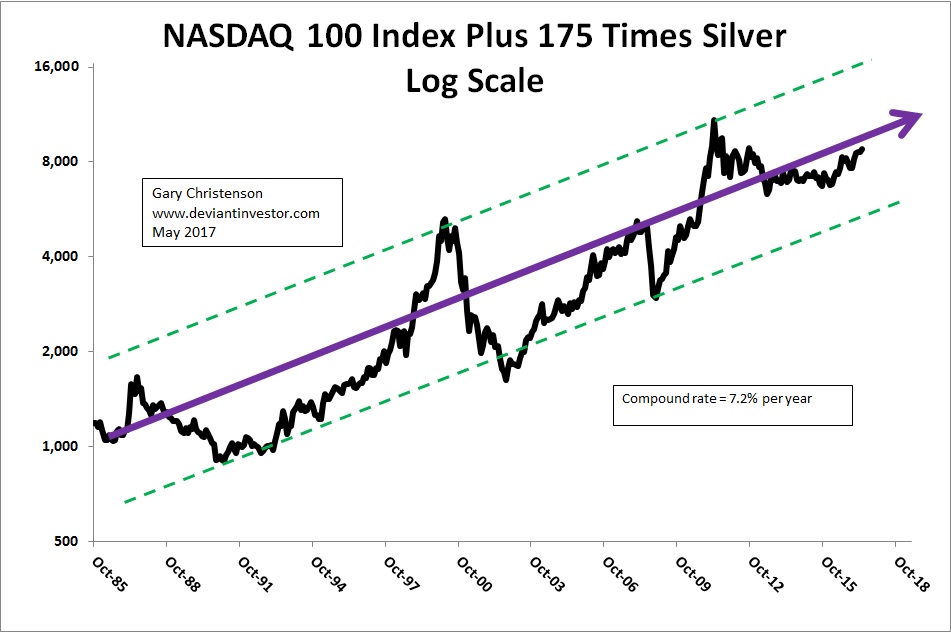
Over thirty years prices have risen exponentially as the dollar has purchased progressively less. Conclusion: Prices rise exponentially and probably will continue to rise as long as governments increase debt and central banksdevalue their currencies.
Is the Nasdaq 100 high and is silver low?
Examine the ratio of 175 times the silver price divided by the Nasdaq 100. When the ratio is high – as in 2011 – silver is relatively high. When the ratio is low – as in 2017 – silver is undervalued compared to the Nasdaq100 Index.
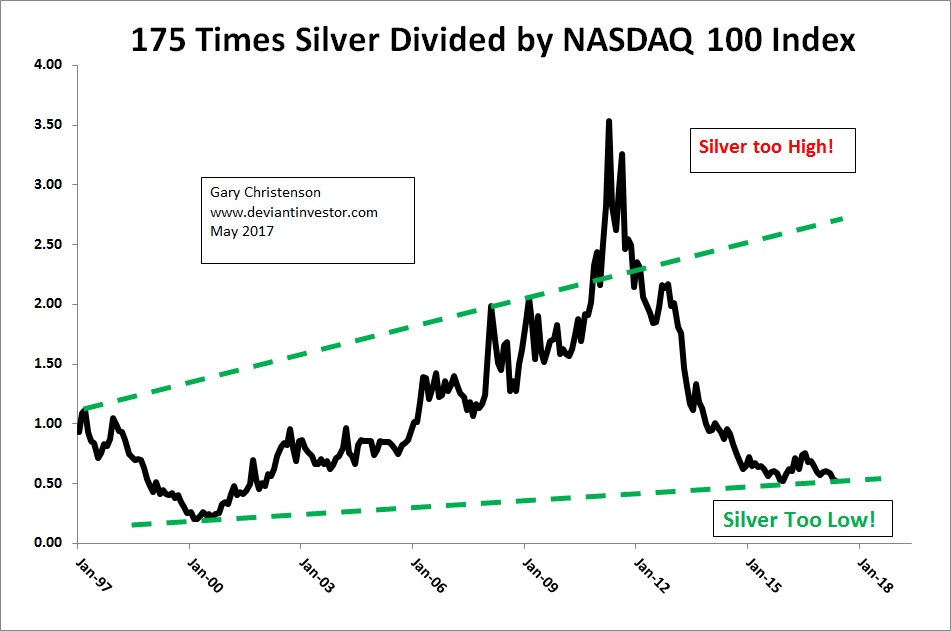
How long will the ratio stay this low? Probably not much longer …
When the Nasdaq 100 top will occur is important if you are riding the Nasdaq bull market. Now is a time for caution.
How much longer silver prices will stay low is important if you are stacking silver, as I hope you are. Take advantage of these low prices!