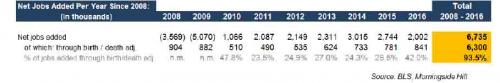
Following Friday’s disappointing payrolls report, yesterday we showed another even more troubling fact about the state of the US labor market: since 2008, over 93% of the total 6.7 million net jobs “created” in the past decade, have been statistical, existing simply inside an excel model somewhere in the US Department of Labor, as a result of the BLS’ favorite fudge factor, the Birth/Death adjustment.
Unfortunately, that’s just the tip of the iceberg for why the US labor market “recovery” is perhaps the biggest ‘fake news’ of the US economic narrative, and as a comprehensive recent analysis issued by Morningside Hill reveals, the state of the US jobs market is far worse than the official data suggest.
Here is the real story.
The US jobs market has been described as the backbone of the recovery – 80 months of continuous jobs growth with unemployment hitting 4.3% – the lowest since 2001. However the perceived strength in jobs creation is at odds with other economic indicators. President Trump ran on a campaign that repeatedly touted “jobs, jobs, jobs.” His emphasis on jobs creation and bringing employment back to America struck a chord with voters. Trump’s election in itself contradicts the popular narrative that the US jobs market is tight and robust. Wages, disposable income and real earnings growth along with low productivity and overall slow economic growth all challenge the BLS’s jobs numbers and thus Wall Street’s perception that the jobs market is tight.
Since the monthly jobs report is eagerly awaited as the most important piece of economic data for financial markets, it warrants a deep dive in order to understand what is going on under the hood. Before we delve into the data, here are some highlights of our findings.

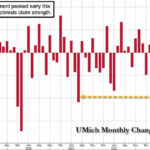
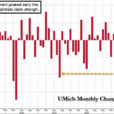
Overall, we have found the headline jobs number, unemployment rate and jobless claims to be poor macroeconomic indicators, since they have failed to account for significant shifts in labor market dynamics.
Who computes the jobs report and how
The “nonfarm payroll employment situation” report (NFP) or the “jobs report” as it is widely known, is calculated monthly by the Bureau of Labor Statistics (BLS) and is released every first Friday of the month. The two most important statistics in the report are the number of jobs added each month and the unemployment rate. The data for these statistics are collected through two separate surveys.
Number of jobs added
The number of jobs added to the economy comes from the Establishment Survey. Basically the BLS sends out the following survey to a sample of about 146,000 businesses.

As per the form, the government gathers the following information: how many employees worked at the firm in that month along with the total employee compensation and hours worked.
By surveying just a small fraction of US businesses, the measurement errors around this survey are significant. The 90% confidence interval is +-120,000 jobs. Thus in the March 2017 report which had +79,000 jobs, 90 out of 100 samples fall within the interval of -41,000 jobs to +199,000 jobs. In other words, statistically it is impossible to say with any confidence that the economy added any jobs that month, since the number crosses the zero bound and could therefore be negative.
Here is the official BLS data for the jobs added over the past 11 years, and a monthly breakdown for 2016.

The main problems with this survey are the double and triple counting of jobs because of a structural shift in labor dynamics and the business birth and death adjustment. We will proceed to tackle both in the following pages.
Double and triple counting of jobs in the Establishment Survey due to the transition to a “gig” economy
The shift to part-time and contract-based work has been a disconcerting development over the past years. This unprecedented growth in part-time work relationships has been dubbed the new “gig” economy, capturing the ad-hoc nature of these work arrangements. Increasingly employers prefer to add temporary part-time workers instead of full-time employees. The rationale is to save costs by paying less for full-time employment perks like healthcare and paid vacation leave among others, while increasing the flexibility for the employer to downsize the workforce if needed. This shift started a few decades ago and accelerated after the financial crisis of 2008.
This new “gig” economy is taking many forms – from Uber and Lyft drivers to multinationals like Amazon and HP – new employees are hired as contractors. A few decades ago part-time and contractual work was mostly utilized in seasonal industries like retail, food services and construction. It has recently spread to manufacturing, technology, airlines, telecoms, financials – it is a structural shift in almost every sector.
As more people are losing their full time jobs they often have to compensate by working multiple part-time jobs to make up for the lost income. For example a laid-off manufacturing employee might need to work 2 or 3 part-time jobs as a waiter at a restaurant and as an office clerk at a healthcare facility. When the BLS does their jobs count in the Establishment Survey they get 1 lost manufacturing job and 2 new jobs in services. Thus, the same employee is double-counted as if 2 new jobs were created for the single job that was lost.
Here is how the BLS treats multiple job holders according to their own definition:
“Establishments report the number of persons on payroll during the pay period that includes the 12th of the month. A person working multiple jobs at different establishments is counted once at each establishment. A person working different jobs at the same business establishment is counted once.”
This creates a perverse environment – as people lose well-paid full-time jobs with benefits, multiple new part-time jobs are created in the economy. However these new jobs are low paid and insecure positions. While the average worker in the economy is worse-off, this dynamic gives a false sense of economic strength.
Needless to say, part-time jobs are far inferior to full-time positions. Contingent workers are facing many challenges compared to full-time employees: