There are no two ways about it: it’s been a rough month, quarter, and year for the world’s reserve currency.
The widely-followed US Dollar Index started the year in peak “Trump Trade” euphoria, with traders expecting a burst of fiscal stimulus to boost the economy and accelerate the Fed’s pace of tightening. Since then, the dollar index has fallen by over 9% as President Trump has struggled to enact his agenda, the Fed has taken its foot off the gas pedal, and most recently, other global central banks have shifted to a more hawkish posture.
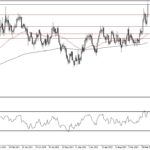
As the chart below shows, the dollar is deep in the dumps against its major rivals. This month alone, the buck has shed another 2.5% to trade below 94.00, its lowest level in over a year:

Source: Stockcharts.com
With the 50-day moving average trending consistently lower and the 200-day moving average also rolling over, it’s clear that the longer-term trend is pointing lower for the greenback.
That said, there are some signs that the currency may see a short-term bounce. After all, the RSI on the dollar index currently sits at 26.7, its most oversold level since September… of 2012. The buck is showing some signs of bouncing back on intraday basis, and traders, who are positioned heavily in favor of more weakness, may look to take profits ahead of tomorrow’s Federal Reserve meeting.
If the US central bank either announces or implies an imminent reduction in its balance sheet, we could see the US dollar recover back toward its falling 50-day MA in the mid- to upper-95.00s. Even if we do see such a recovery though, the well-established downtrend suggests that readers favor shorting into any near-term bounces in the dollar unless it’s able to break meaningfully back above the 50-day MA toward the mid-96.00s