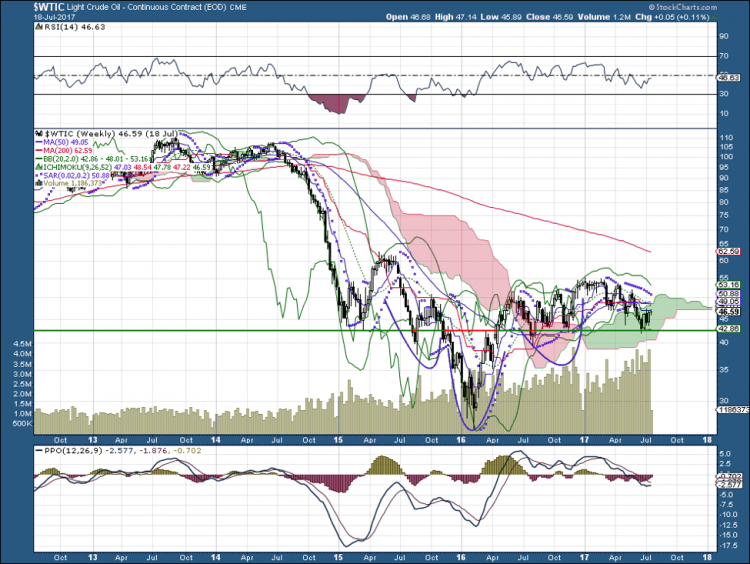
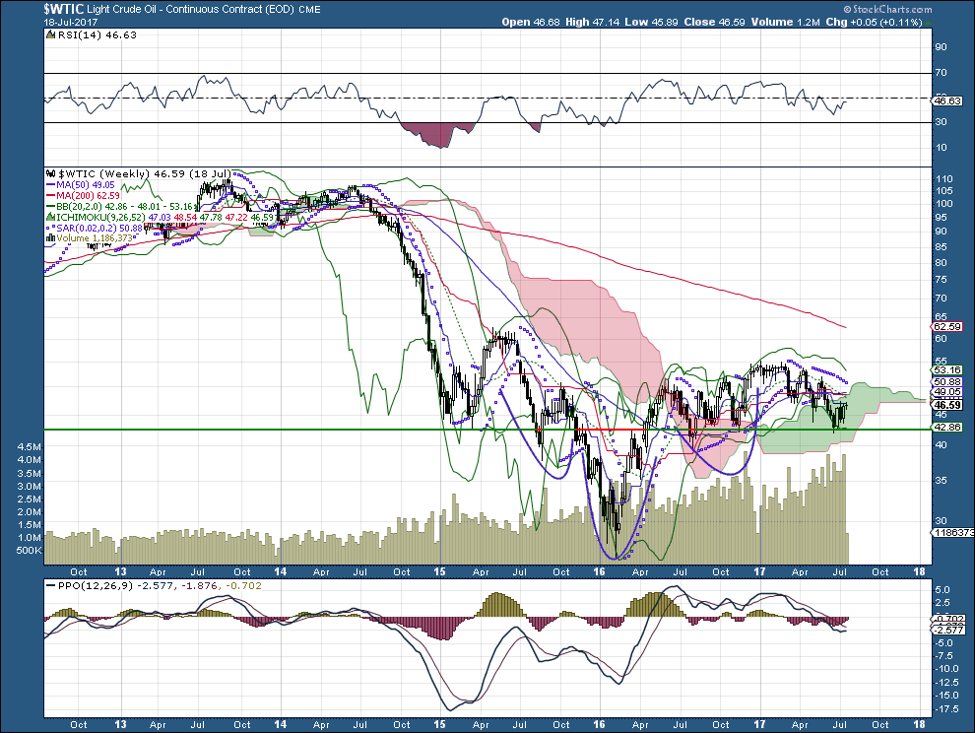
In various earlier columns, I have discussed the significance of the head-and-shoulders pattern as a signal that a stock, commodity or what not is ready to reverse direction. The blue parabolas in this five-year chart of West Texas Intermediate oil prices suggest quite strongly that this commodity hit rock bottom 18 months ago. If this is true, the rising commodity price will mean a rapidly recovering energy sector. As I have suggested a few times in recent months, that process has already begun.
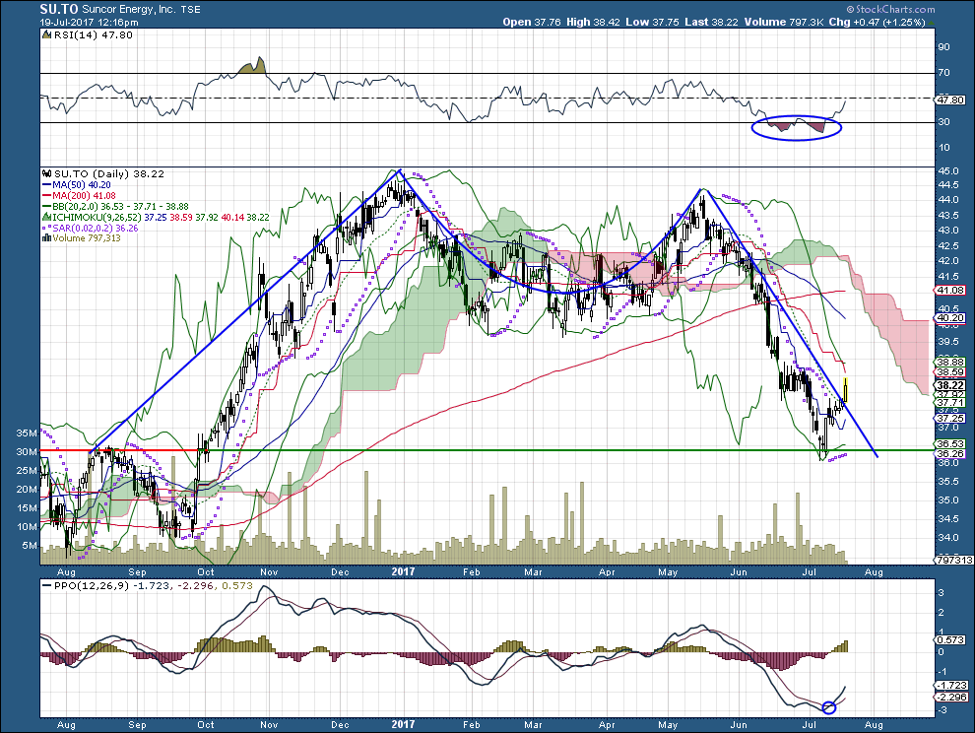
My most recent call was Suncor, the largest energy company in Canada. My thesis was essentially that the stock is ready to recover from collapse after a double top formation – a double top that took the form, roughly, of the “M” described in the chart below. I’m pleased to note that the call has held so far. My optimism remains strong – not only for oil producers but also for the petroleum service sector.