A lullin top-tier event risk allowed space for gold prices to consolidate after Friday’s sharp downswing in the wake of June’s upbeat US labor-market data. From here, a lackluster offering on the data docket puts Fed-speak in the spotlight.
Comments from Governor Lael Brainard, the Fed’s most vocal dove, are due to cross the wires. If even she appears to favor another rate hike in 2017, skeptical financial markets may begrudgingly resign to a more hawkish baseline outlook and send gold lower. Significant follow-through seems unlikely however as investors await testimony from Fed Chair Yellen later in the week.
Crude oil prices likewise marked time. The lull may be broken as API weekly inventory flow figures are revealed. Official DOE numbers due the following day are expected to show a 2.46 million barrel drawdown. If API reports a larger outflow, prices are likely to rise. A smaller one will probably see them fall further.
Meanwhile, an updated version of the EIA short-term energy outlook will be released. Another downgrade may reinforce bets that swelling US output will continue to offset OPEC-led production cut efforts. Absent signs of broadening support for deeper output reduction from the sidelines of the World Petroleum Congress still taking place in Istanbul, this may rekindle selling pressure.
GOLD TECHNICAL ANALYSIS – Gold prices paused after touching the lowest level in four months. From here, a daily close below the 1195.13-99.67 area (March 10 low, 38.2% Fibonacci expansion) targets the 50% level at 1169.89. Alternatively, a reversal back above the May 9 lowat 1214.40 – now recast as resistance – opens the door for a retest of the 23.6% Fib at 1236.51.
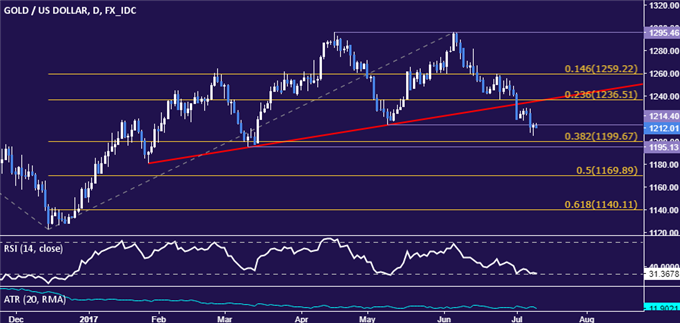
Chart created using TradingView
CRUDE OIL TECHNICAL ANALYSIS – Like gold, crude oil prices also paused to chew over recent weakness. Near-term support remains in the 43.51-79 area (38.2% Fibonacciexpansion, May 5 low), with a daily close below exposing the 42.08-35 region (June 21 low, 50% Fib). Alternatively, a rebound back above the 44.96-45.32 zone (former support, 23.6% expansion) targets the 47.03-12 range (chart inflection point, 50% Fib retracement).