Crude oil prices made little headway on Friday, with the WTI benchmark range-bound in familiar territory. US refinery closures courtesy of Hurricane Harvey drove gasoline upward but raw-material costs conspicuously didn’t budge. Monday’s underwhelming offering of scheduled event risk may leave markets rudderless until the API set of weekly inventory flow statistics comes out on the following day.
Gold prices seesawed but ultimately failed to find directional follow-through as Fed Chair Janet Yellen spoke at the annual symposium in Jackson Hole, Wyoming. The US central bank chief conspicuously avoided offering pointed policy guidance, leaving the fate of its on-coming balance sheet reduction effort, so-called “quantitative tightening”, shrouded in mystery.
A dull day on the US data front may put sentiment trends in the spotlight. S&P 500 futures are pointing cautiously lower ahead of the opening bell on Wall Street while the perennially anti-risk Japanese Yen trades broadly higher, hinting at a sour mood as the week gets underway. That may translate into lower Treasury bond yields, boosting non-interest-bearing assets including the yellow metal.
GOLD TECHNICAL ANALYSIS – Gold prices continue to mark in familiar territory below resistance in the 1295.46-97.95 area (double top, 23.6% Fibonacci expansion). Negative RSI divergence hints a turn lower may be brewing ahead, with a break below rising trend line support at 1287.10 exposing the 23.6% Fib retracement at 1278.22. Alternatively, a daily close above resistance opens the door for a test of the 38.2% expansion at 1311.94.
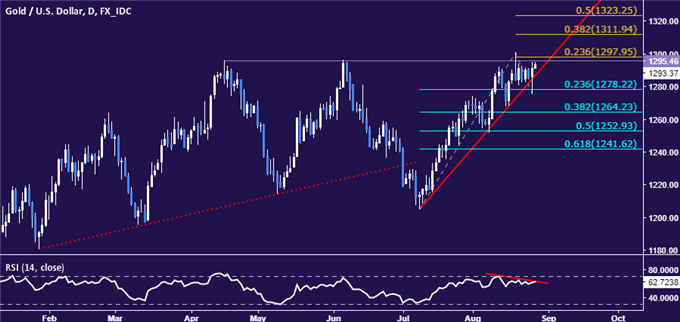
Chart created using TradingView
CRUDE OIL TECHNICAL ANALYSIS – Crude oil prices remain locked in a narrow digestion range below the $49/barrel figure. Near-term support is at 46.62, the 38.2% Fibonacci expansion, with a daily close below that clearing the way for a challenge of the 50% level at 45.46. Alternatively, a move above support-turned-resistance at 48.76 exposes a trend line confluence point at 49.60, followed by the August 1 high at 50.40.