Here is a quick review of the global markets. Most markets are in the midst of a pullback within a broader uptrend.
S&P 500 (US)

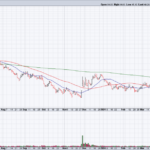
The S&P 500 is down about 3% from it’s recent all time highs. Currently fighting to stay above the 50 day MA. A break below 2417 makes the 200 day ma (red line) likely to come into play.
Nikkei Average (Japan)

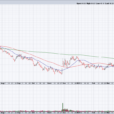
After breaching the 20,000 level earlier this year, Japan’s stock index is currently testing the 200 day MA on a pullback closer to 5%.
CAC 40 Index (France)

France’s stock index has retraced all of the gains post election. It’s down about 6.6% from it’s recent highs, but still trading above the 200 day MA for now.
DAX Composite (Germany)

Germany has a similar setup, also down 6.5% from recent highs.
FTSE Index (UK)

UK is also in a similar setup, only down 3.50% from recent highs.
Shanghai Stock Exchange (China)

Bucking the trend is China, which has broken out of its recent trading range and making new highs.
Internals (Advance – Decline line)

The NYSE advance decline line continues to show strength overall. A short term bearish divergence could be setting up (possible lower high) if the cumulative average breaks below the recent low.
Equity Performance

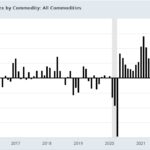
A currency adjusted performance chart shows US stocks under-performing International developed and emerging market stocks by a wide margin year to date.
The reason for this has to do with the performance of the US dollar.

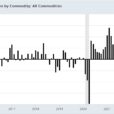
The trade weighted average peaked in late 2016, right around the prior high in 2001.

If we drill down and look closer at recent price action, we can see the decline more clearly. This accounts for much of the international equity out-performance.