<
Early Warning Signals in a Fragile System
We recently received the following charts via email with a query whether they should worry stock market investors. They show two short term interest rates, namely the 2-year t-note yield and 3 month t-bill discount rate. Evidently, the moves in short term rates over the past ~18 – 24 months were quite large, even if their absolute levels remain historically low.

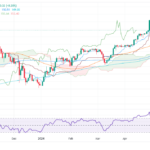
Sizable moves higher in short term interest rates were recorded over the past two years. 2 year note yields only started moving up in mid 2016, but the surge in t-bill discount rates has been in train since late 2015 already. The moves in short term rates come from extremely low levels, but they are nevertheless quite noteworthy – click to enlarge.
The first thing that comes to mind in connection with asset prices is that the cost of carry for leveraged positions is rising. Eventually, this will have an effect on such positions, particularly in fixed-income instruments, which inter alia include structured products such as CLOs (collateralized loan obligations). Some market participants reportedly employ leverage of up to 1:10 in these in order to boost returns, which the banks are apparently happy to provide, as the risk is deemed to be low.
As we have discussed previously, CLOs are conceptually not different from the CMOs that created such heavy conniptions in 2007-2009, but CLOs ultimately turned out to be quite resilient at the time. The problem is of course that it is definitely not a given that they will be similarly resilient in the next crisis. Banks no longer have large proprietary books of corporate bonds, but by providing margin loans to investors who buy them on leverage, they remain exposed – and the degree of leverage is reminiscent of the margin requirements of Wall Street bucket-shops in the 1920s.
Obviously, these enhanced returns are highly dependent on borrowing costs, so rising short term rates are bound to become a problem at some point. As a more general remark: the central bank policy of suppressing rates to zero or close to zero provided the incentive for investors to take up enormous leverage, which is seen as the only way of obtaining half-way decent yields. In other words, central bank manipulation of interest rates has definitely made the financial system a lot more fragile.
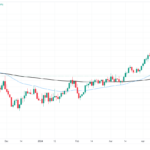
There is a feedback loop between the Federal Reserve’s interest rate policy and market rates, but market expectations are historically the main driver; it usually appears as though the Fed is simply following the lead of market rates. It should also be noted that market-based inflation expectations so far remain quite subdued. 5-year TIPS yields have oscillated between -10 to +30 basis points this year, after trading as high as 52 basis points in December 2015.

5 year TIPS yields are a good proxy for medium-term real interest rates. They indicate that inflation expectations remain fairly subdued so far – click to enlarge.
Free Capital Begins to Run Short
Apart from increasing the cost of carry of leveraged positions, the surge in short term rates is a sign that the distortions in realtive prices underlying the current shape of the economy’s production structure may be about to flip-flop (i.e, the distortions that have led to investment being drawn toward capital goods production to the detriment of consumer goods production). Social time preference begins to reassert itself, and a shortage in “free capital” is beginning to emerge (this terminology was used by Richard von Strigl).*
There is no limitless reserve army of workers one can draw from and real capital is scarce. Both have to be properly allocated, and as discussed in Part 1, the inter-temporal allocation process is regulated by interest rates. In a free market, a decline of interest rates to near zero would indicate that time preferences are extremely low. By implication, people would be saving a very large percentage of their income in such an environment (we assume these are mainly capitalist savings, i.e., they are made available to borrowers in the market).
This has an important effect: it increases the size of the pool of real funding. Real savings consist of all the final products people could have consumed, but refrained from consuming because they decided to save and invest instead. They made a sacrifice in the present, in order to be able to consume more in the future. Note: there is no other way to grow the economy.

A chart illustrating what occurs in a free market without central bank interference (and assuming no credit expansion.**), after a decline in social time preference and a commensurate increase in savings. [legend: S= old level of savings, S’=new level of savings, D=demand for loanable funds, i-eq=old equilibrium interest rate, i’-eq=new equilibrium interest rate, C=consumption, I=investment]; [ed note: we have inserted the more descriptive image of the “Hayekian triangle” inside the blue rectangle in the lower left quadrant again as a conceptual aid – it is otherwise not part of this chart. The triangle is, of course, a highly simplified stand-in for the complex latticework of the economy’s capital structure, but it is obviously very useful for explaining the associated processes]. In the top half of the chart, we see how the triangle is shaped before and after the increase in savings and investment. After the new savings are allocated, factors of production are withdrawn from the now comparatively less profitable lower stages (called “late stages” in the insert) and added to the higher stages. But that is not all: new stages that didn’t exist before are added, lengthening the production structure (this can also be thought of as an expansion in the division of labor). Ab initio this will increase production time, but it will at the same time increase productivity – the more roundabout production processes become, the more productive they will be, even if there is no advance in technology or production methods otherwise. Looking at the PPF (production possibilities frontier) to the right, we can see that the previous lower amount of savings and the associated “height” of the triangle intersected at a point indicating greater consumption and less investment, which is commensurate with higher time preferences. The new intersection on the PPF is at a point that indicated a shift in the consumption-investment balance in favor of investment. Overall, these are two snapshots in time, we essentially see the situation right before and right after the new savings and investments were added. At the particular point in time when S’ and i’-eq prevail, consumption is, in fact, smaller than it was before. Mr. Draghi and Ms. Yellen would no doubt be apoplectic, but as Friedrich Hayek reminded his fellow economists 85 years ago***: “Money spent today on consumption goods does not immediately increase the purchasing power of those who produce for the future; in fact, it actually competes with their demand, and their purchasing power is determined not by current but by past prices of consumer goods. This is so because the alternative of investing the available productive resources for a longer or a shorter period of time always exists. All those who tacitly assume that the demand for capital goods changes in proportion to the demand for consumer goods ignore the fact that it is impossible to consume more and yet simultaneously to defer consumption with the aim of increasing the stock of intermediate products.” (emphasis added) – click to enlarge.