In Part one I talked a lot about Moving Averages in extended market climates such as the one we are currently in. Hence:
There comes a time where markets get extended away from the 50-day average. That’s where shorter-term moving averages come into play.
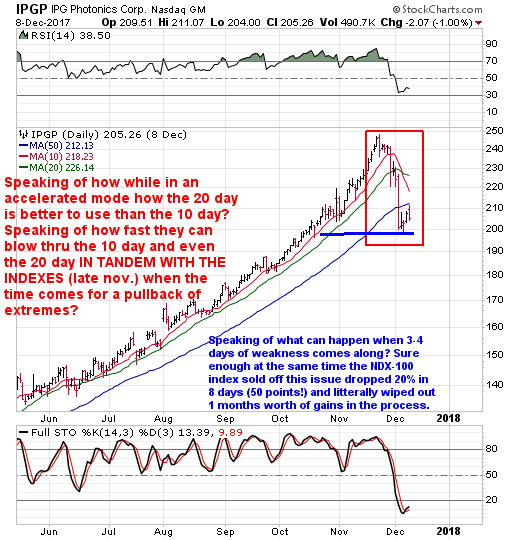
Keep in mind when dealing with the 10 and 20-day averages they are what I like to call moving averages for use in accelerated up trending markets.
I’m not a big fan of using them as they tend to burn themselves out rather fast to the upside when an issue or the market turns which in turn makes them prone to breaks to the downside a lot faster than the 50-day average. Not to mention they tend to whipsaw one quite a bit (mostly the 10 -day) and really don’t allow for that much wiggle room.
Take a look at IPGP here as it too gives you a good idea as to why I don’t like to use the 10-day average as a trailing stop due to too many whipsaws vs the 20-day average generally speaking.

Now that you’ve seen a really scaled down version of Part one let’s talk about what I call THE MOVING AVERAGE COUNTDOWN CLOCK.
In the last article, we touched upon the 50-day, 20-day and 10-day average. We really don’t have too many moving averages left, you know.
In the index charts below I added the last moving average there is when it comes to the use of extremely short-term moving averages in extended market climates and that is the 5-day moving average. Look at it all as a countdown clock. A burn itself out countdown clock I might add.
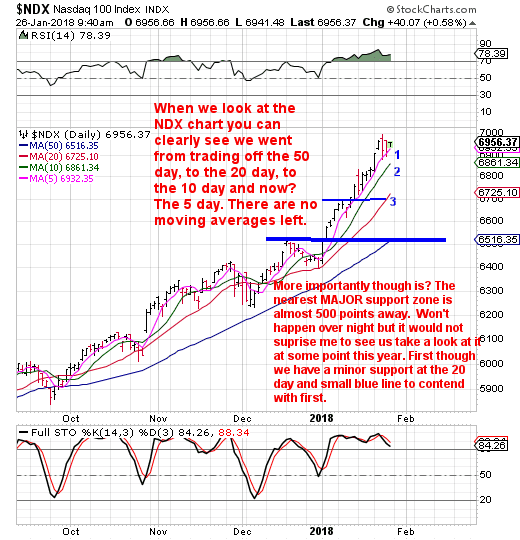
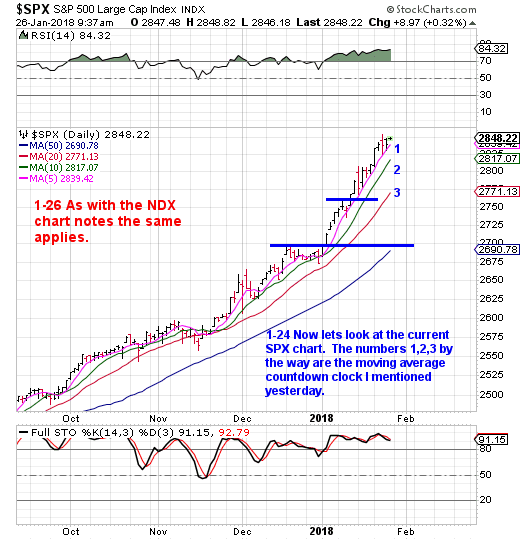
We went from trading off the 50-day, 20-day, 10-day and now the 5-day? Heck, that’s the same thing as 54321. Normally we associate that countdown clock with a blast off. In this sense flip it over. We’ll associate it with burn out as in, burning itself out to the upside.
The higher we go here the more you had better have a seat for when the music stops and the monkey flips a switch. The higher we go, the bigger the drop when it shows up.
Remember as I’ve recently said, volatility is a two-way street. We’ve just seen one street and to an extreme, I might add just like the 2000 and 2007 peaks and we all know bigger picture how that turned out now haven’t we. Each of those bull market cycles had a theme by the way. Dotcom crash and real estate bubble. So what is going to be the theme the next go around?
Honestly, I have no clue and neither does anyone else. I will say this though and that is aware of the program trading/high-frequency trading firms. We’ve just been seeing what they can do to the upside here, we just haven’t really seen what they can do when they play the sell side of the equation to any great degree. Ok, we have but not for an extended period of time, think the flash crash and even the SOX/NDX flashes to the downside of June of 2017.