One of the foundational principles of technical analysis is that asset prices move in trends. The intent of any technical trader is to enter early in the price’s trend and exit when it changes.
A chartist’s use of moving averages, trend lines and other indicators are an attempt to determine the direction of the price trend. Trend trading is, therefore, a systematic way of reading and trading the direction of the trend.
As you begin to develop a systematic way of trend trading, a common question that comes up is, “Which trend?” Trends can be intraday or can appear on daily, weekly or monthly charts.
One of the most important principles of technical analysis is that it is “fractal” in nature. That means you can technical analysis principles like trend, support and resistance to a daily chart. You can also apply to charts of various aggregation periods. This includes periods such as intraday, weekly or monthly.
In this Intro to Trend Trading, you’ll learn about the difference between trend and swing trading. You’ll also learn about trend timeframes and trending indicators. Finally, you’ll learn invaluable risk management methods you can use when trend trading.
Trend Trading Versus Swing Trading
It’s very common for traders to confuse the concept of swing and trend trading. Both strategies are, in fact, trading trends. However, the approach is quite different. For example, a swing trade captures the price movement as it “swings” from a cyclical low to a cyclical high or vice versa.
Trend trading intends to ride out the cyclical highs and lows as long as the “trend” is intact.
We determine trend based on the progression of cyclical highs and lows in the price. Therefore, the definition of an uptrend is a series of higher highs and higher lows. The definition of a downtrend is a series of lower highs and lower lows.
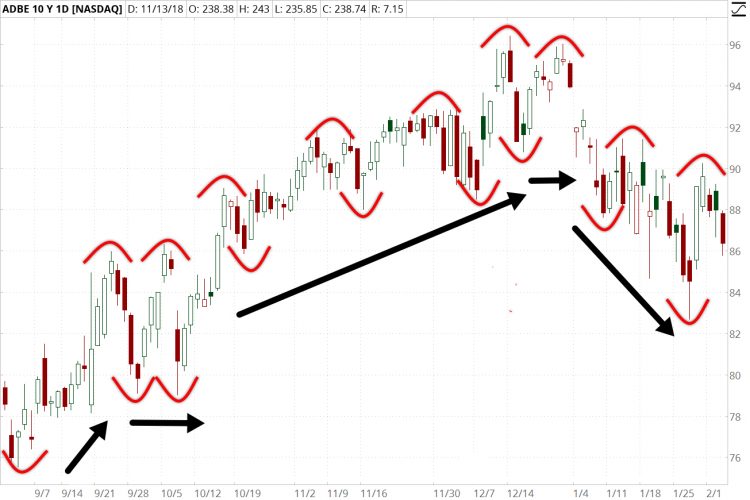
The foundation for trend trading is formed by the trend in the cycle of highs and lows–which was popularized in the 1980’s. In the chart below, you’ll see an example using Adobe Inc. (ADBE) as it progressed through periods where it was trending up, down and sideways.
The red curves denote the cyclical highs and lows. The black arrows indicate the trend based on the progression of highs and lows.

In the chart, there were many opportunities for bullish swing trades while the price was in a neutral to bullish trend. In contrast, there was essentially one trend trade made an exit when the support broke at the beginning of January.
The swing trader is trying to capture more frequent smaller swings within the trend to generate a higher profit potential.
This is accomplished by selling at a higher price and buying back at a lower price. While the swing trader always has a greater potential for profit, it can be difficult to realize that potential. Trend trades will typically outperform when the trend experiences shallow pullbacks or upward gaps that the swing trader missed.