As we approach the final month of this year, it’s worth reflecting on our thoughts and actions over the past year. Reflection is how you become a better investor and trader.
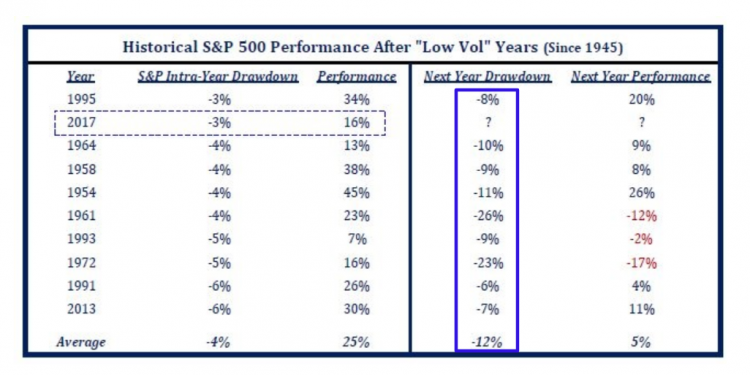
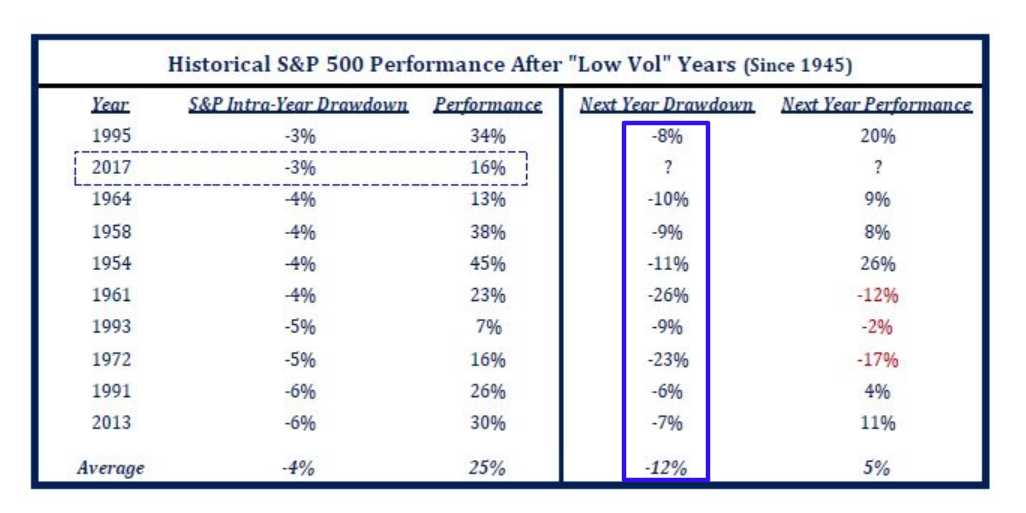
I posted the following chart in December 2017. Interesting how this year’s max drawdown is pretty much in line with the average drawdown of -12%.
Let’s determine the stock market’s most probable direction by objectively quantifying technical analysis. For reference, here’s the random probability of the U.S. stock market going up on any given day, week, or month.

*Probability ≠ certainty.
Late-cycle behavior
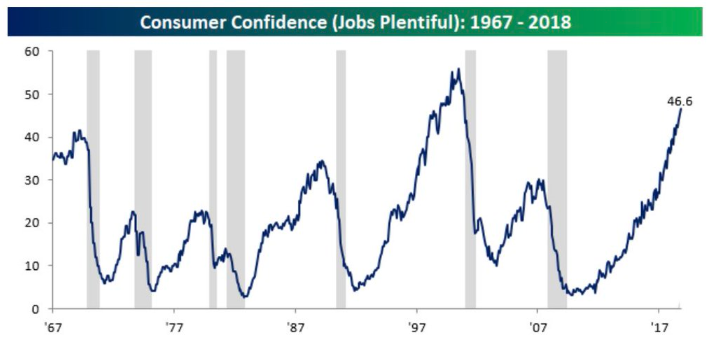
According to the Conference Board, a very high % of consumers are saying that jobs are “plentiful”. This mirrors the very low unemployment rate and tight labor market.
In other words, this is a sign of “as good as it gets” for the economy (and hence the stock market).
Here’s what happened next to the S&P 500 when the % of consumers saying “jobs are plentiful” exceeds 46%.
*Data from 1967 – present
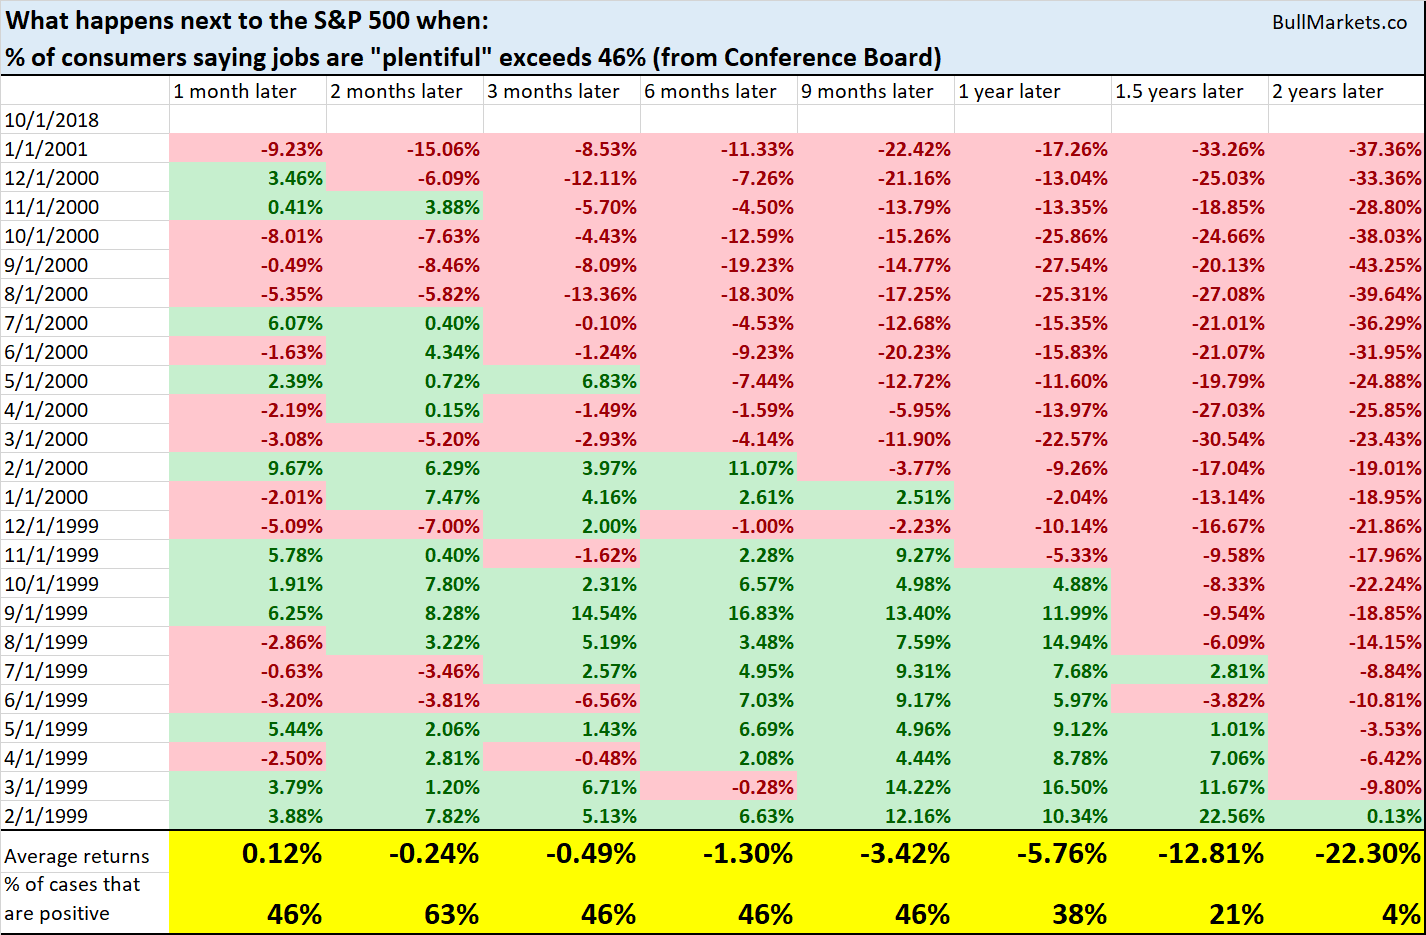
Notice how every single case is from February 1999 – January 2001. The first time this happened in the last cycle was February 1999, 1 year before the bull market topped. This suggests that the bull market has 1 year left, at most.
Sotheby’s
Sotheby’s shares have fallen a lot recently, down more than 1/3 from a 1 year high. Some people think Sotheby’s is a leading indicator for the stock market because high-end purchases are generally leading indicators.
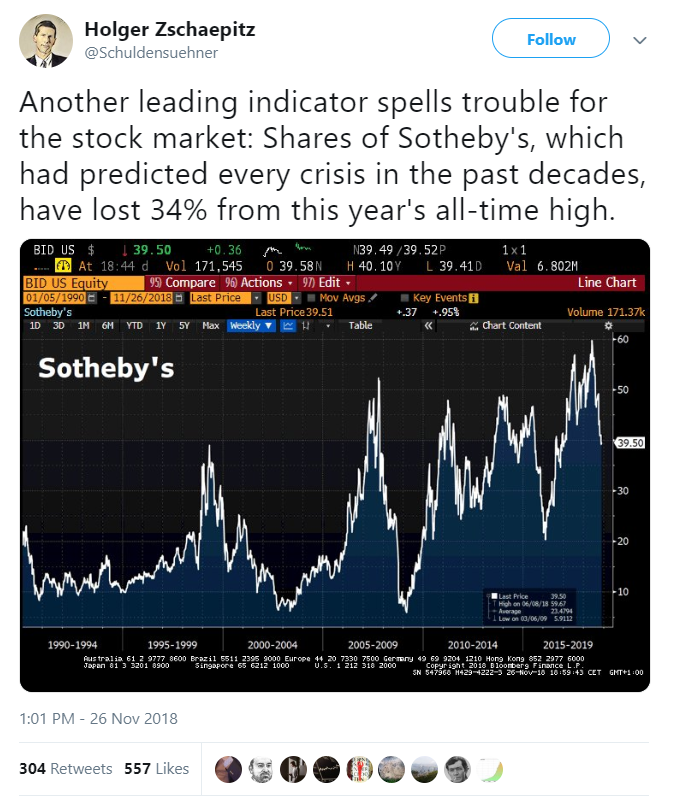
While it’s true that big-ticket economic indicators are leading indicators for the stock market and economy, using 1 stock to predict the whole stock market is silly, to say the least. It’s like the people who used IBM’s demise to predict the stock market’s demise from 2013 – present (clearly that didn’t work out for the permabears).