Key Takeaways
- Exchange balances have seen a steep drop in the last two days.
- Research from Jarvis Labs analyst Benjamin Lilly points to an imminent liquidity crisis of Ether on exchanges.
- In comparison to the previous two bullish cycles, the market flow data points to more upside.
Bitcoin and Ethereum are being withdrawn from exchanges in large amounts. In light of that trend, on-chain analysts suggest that the prices of both cryptocurrencies could rise higher.
Visible Signs of a Bubble
In a bullish phase, the market runs hot and cools down in cycles. Altcoin prices rise and enter a bubble-like market. Traders recognize tops and correction cycles, each time forming higher highs and lows.
Eventually, the market runs out of steam, and the local top becomes a generational top. During this upthrust, liquidity flows towards altcoins, causing abnormal gains with a lack of fundamentals.
These are returning signs of a bubble as altcoins exhibit irrational exuberance. For instance, yesterday, the Stellar blockchain went down for a brief period, but its native token XLM held onto the previous day’s gains of 25%. Meanwhile, XRP has reached $1 despite its pending securities case filed by the SEC.
Still, on-chain analysis of the top two cryptocurrencies—Bitcoin and Ethereum—suggests that the market has not yet reached its top.


Ethereum Liquidity Crisis
Benjamin Lilly of on-chain research firm Jarvis Labs mapped the correlation between reducing exchange supply and ETH price. According to Lilly, ETH “is gearing up for a historic run.”
He found that in 2017 exchanges saw 44% lesser Ethereum balances, and users withdrew ETH to personal wallets. This time around, exchanges have witnessed a 25% reduction in supply. Moreover, the total ETH supply is 38% more than the last time, representing larger overall supply-side liquidity.
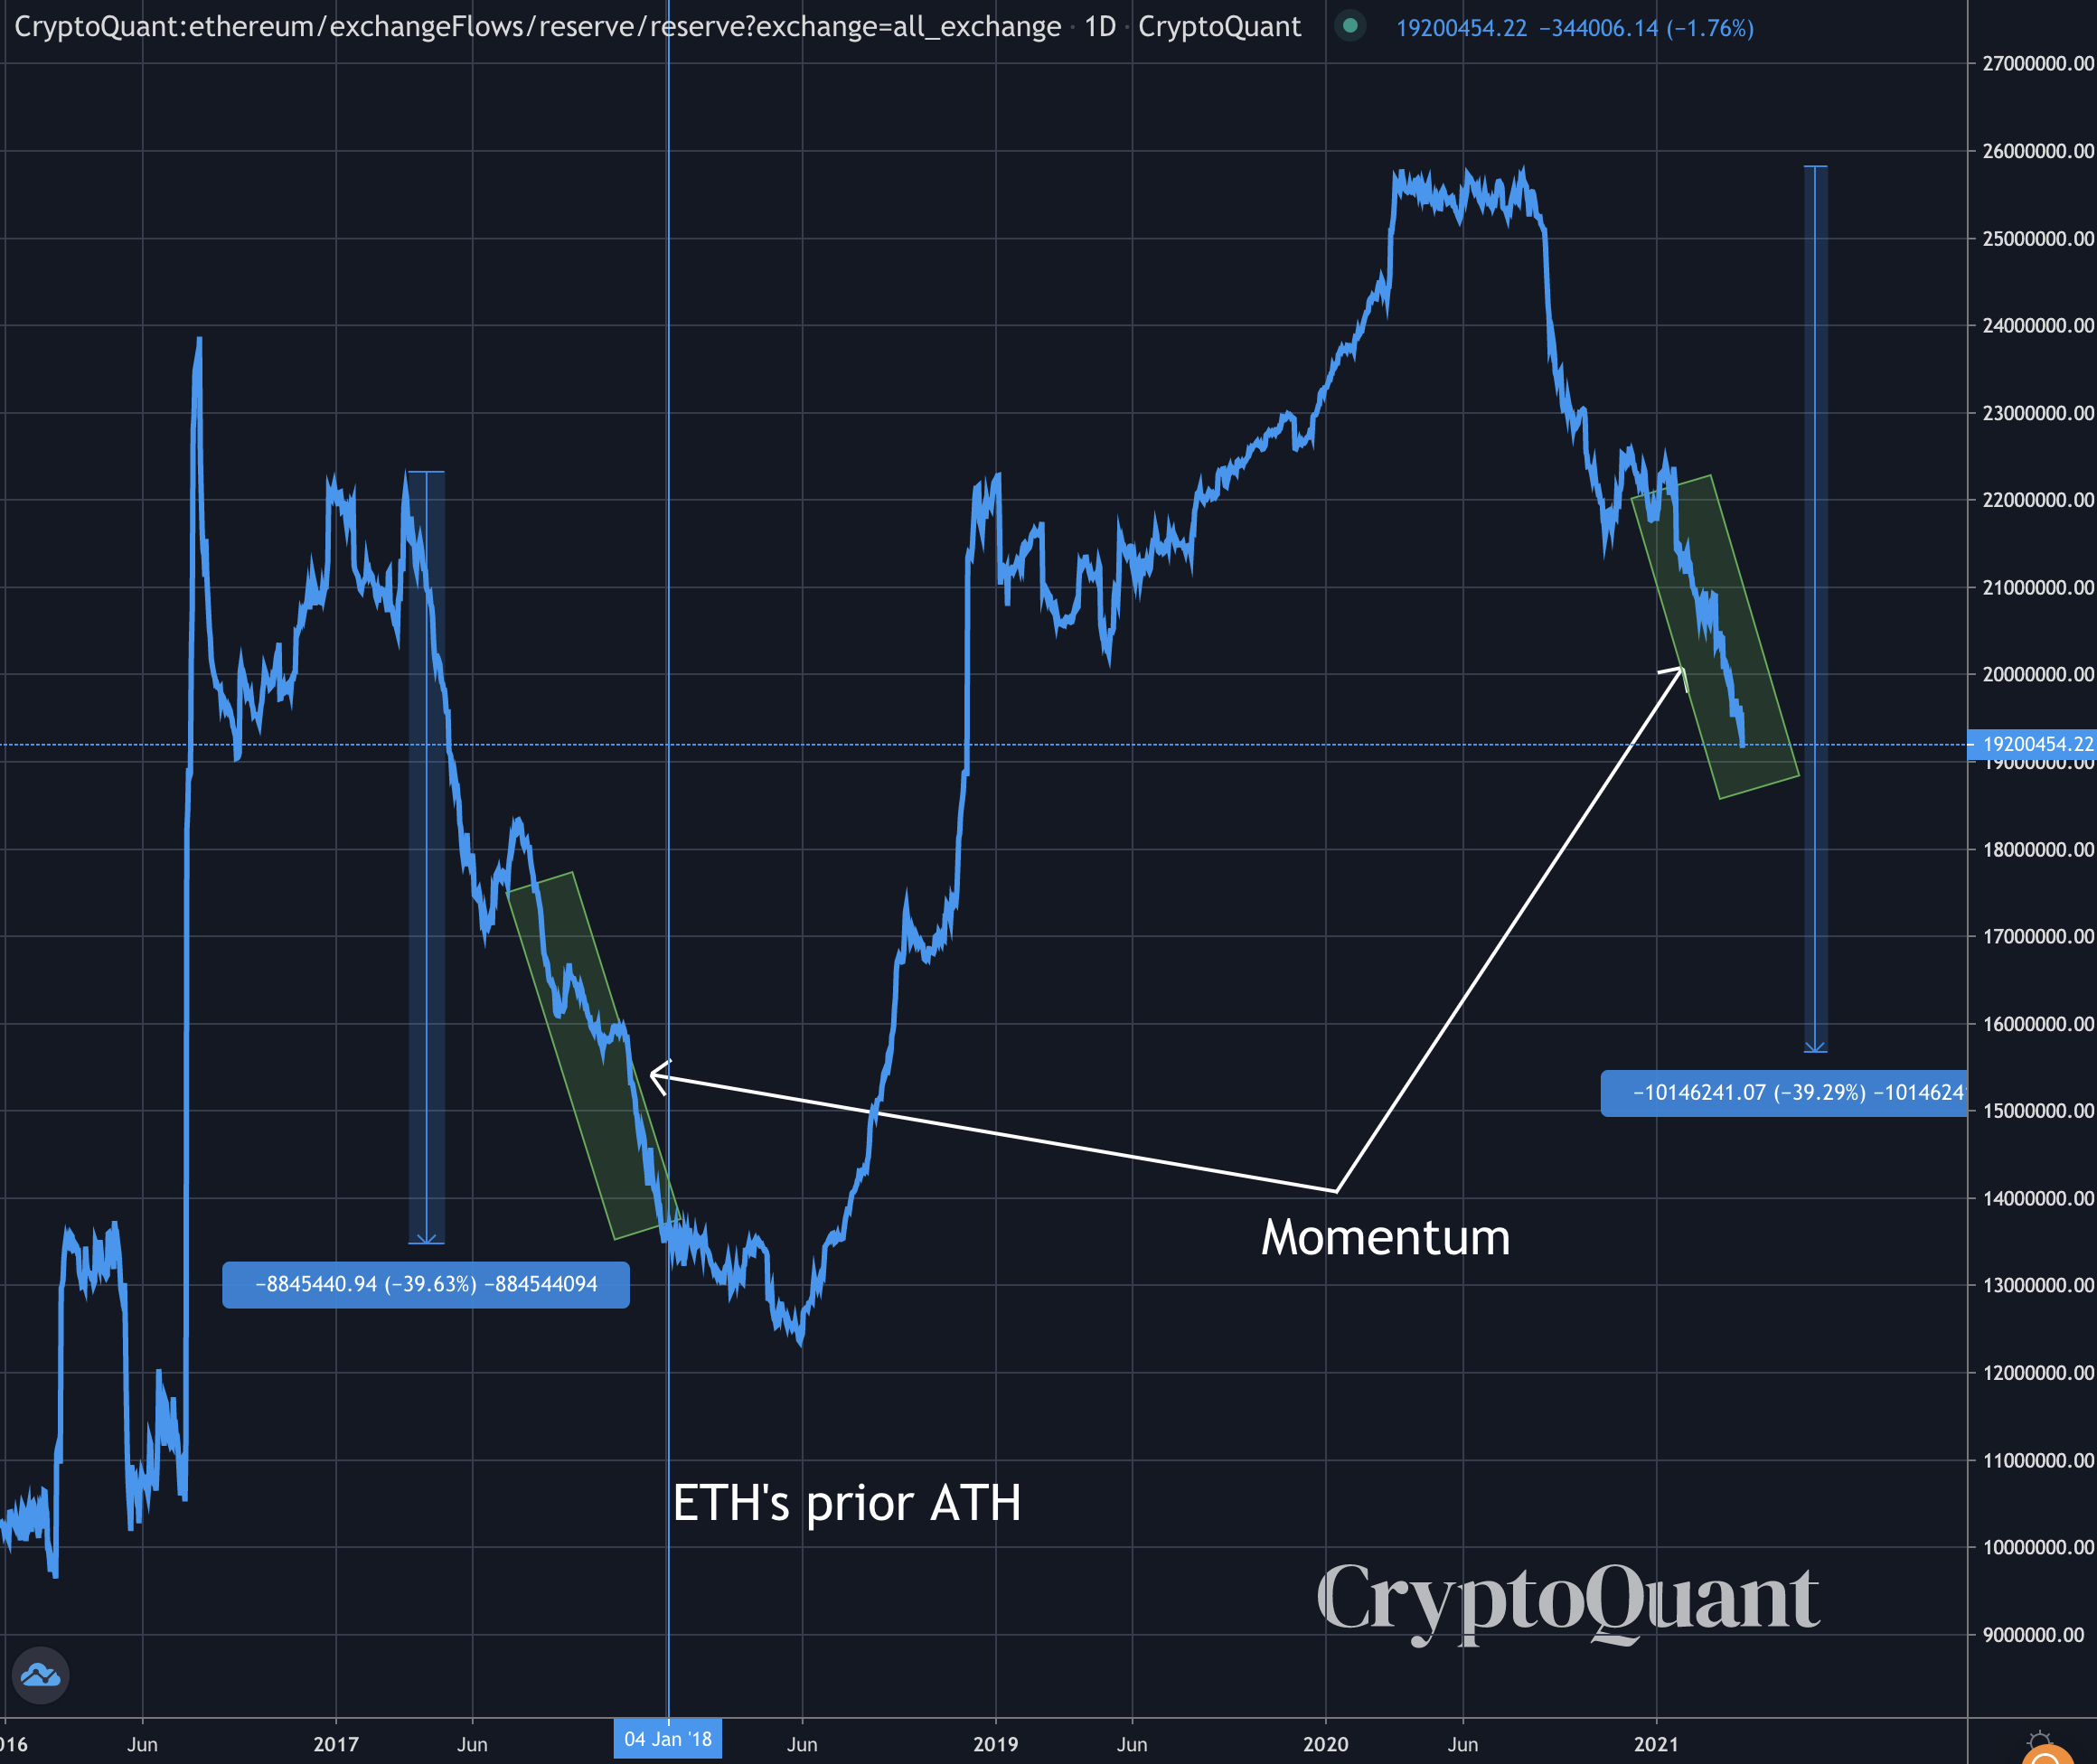
Lilly predicts that the demand is looking to ramp up and create explosive effects in price. This thanks to “growing institutional demand due to the unethical management of the dollar, Grayscale Effect,” and the mainstream acceptance of the crypto in NFTs, the base layer for stablecoins and other FinTech applications.
Bitcoin Continues Buying Trend
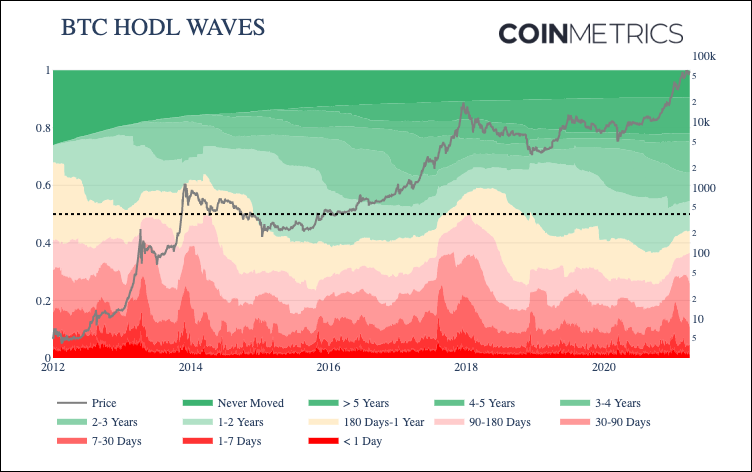
Similarly, Bitcoin hasn’t exhibited signs of a long-term cycle top as well. Bitcoin’s age distribution bands metric has been a robust indicator of market tops in the past.

The metric, also called HODL waves, separates the Bitcoin addresses based on the last deposit and withdrawal time.
A wide short-term supply band indicates that buyers are hyperactive, which has happened near the market top twice before. “36% of supply was active within the last 180 days, still well below the peak of about 50% during January 2018,” wrote Coinmetrics‘ Nate Maddrey.
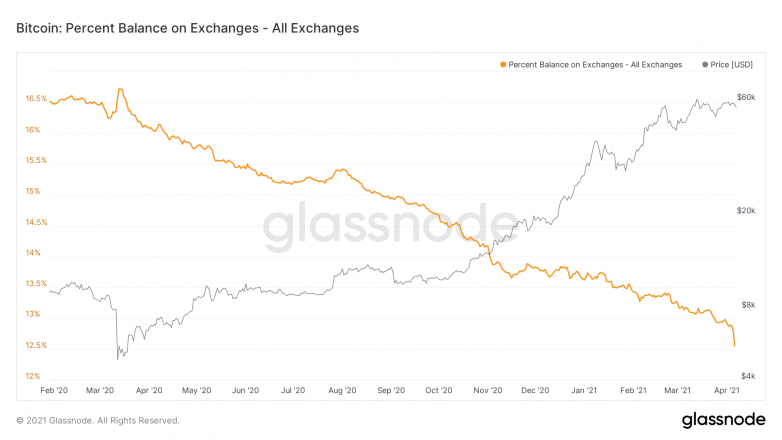
Besides this trend, a large amount of Bitcoin left exchanges in the last two days as BTC dropped below $59,000. The steep drop in the yellow line represents the largest sweep since November 2020.
At the time of writing this author held Bitcoin and less than $15 of altcoins.