I imagine that you, like me, look forward to reading about the markets that are rarely covered.For example, yesterday we looked at Truth Social (DJT), which rallied nearly 50% today. That might go down as the most fascinating stock story – how a worthless company catches all the green lights in 5 days.Maybe all the buzz I read constantly about everything markets stayed in my subconscious.Maybe this can explain why last night I had a dream.I literally woke up to the words “Swiss francs.”So here I was at 4 am, checking the charts of Swiss Francs, both in the futures market and then with the ETF FXF in multiple timeframes. 
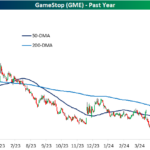
The first thing I noticed in the futures market is that CHFUSD (Swiss Franc to the US Dollar) has been in a freefall for a while.There is some support from the lows in October at 1.08. That would not give us a compelling enough reason though, to heed my dream as prophetic in any way.The second chart is far more interesting of FXF the ETF, on a daily timeframe.Look at the volume patterns over the last couple of days. The average daily volume is around 32k. Last Friday the volume was 251k or 5 times the average.The next day is was 152k. Thus far, on day of writing, we are back to the average.However, the candlestick pattern is one of an inverted hammer doji. This can become important combined with the crazy volume as a blow off bottom.Can become.There’s more.SNB had an interest rate cut, a big reason for the Franc’s recent tumble.With research I read this, “The Swiss Franc has a reputation for being a safe haven or hard currency; it is often purchased during financial uncertainty due to its reliability and stability. Regularly used as a global reserve currency, the Swiss Franc is the sixth most traded currency in the world.”Fascinating as the dollar strength right now has taken away some of its thunder, while many believe the US debt crisis will be the dollar’s ultimate downfall. 
So, I looked further into longer timeframes.Note on the weekly chart of FXF the 200-week moving average (green) coming into focus.That MA has held for about a year. 
On the monthly chart, FXF is moving closer to the 23- and 80-month moving averages.Even more importantly, the price has been above both MAs since a year ago.If you put this all together, we will watch for signs of a reversal bottom.And happily, we have some valuable moving average lines in the sand as risk points.Perchance to dream…
ETF SummaryS&P 500 (SPY) 520 pivotalRussell 2000 (IWM) 202 supportDow (DIA) 385 support 400 resistanceNasdaq (QQQ) 440 the pivotal areaRegional banks (KRE) 45-50 rangeSemiconductors (SMH) 223 support near termTransportation (IYT) 68 area supportBiotechnology (IBB) 140-142 resistance 135 supportRetail (XRT) 73 support 77 resistance to cleariShares iBoxx Hi Yd Cor Bond ETF (HYG) 77 big number to hold. Over 78 risk ONMore By This Author:DWAC Begins Trading Under DJT
FOMC – Dovish Or Hawkish Or A Bit Of Both?
Ahead Of The Fed – Eyes On Long Bonds TLT