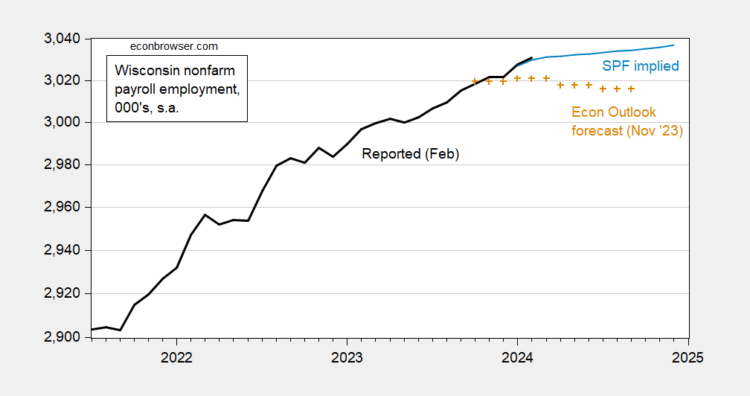
Employment still outstripping the November Wisconsin DoR forecast, based on SPGMI national outlook.  Figure 1: Wisconsin nonfarm payroll employment (black), DoR forecast (tan +), implied from SPF forecast, 000’s, s.a. Source: DWD, Wisconsin Dept. of Revenue (Nov.), SPF and author’s calculations.The Wisconsin Economic Outlook forecast from November was based on the slowdown at the national level built into the S&P Global Market Insights forecast from that month. To the extent that the slowdown has not materialized, it’s not surprising that the forecast is being outperformed.The SPF implied forecast is based on 2021M07-2024M01 regression in first differences, which indicates each one percentage point increase in US nonfarm payroll employment is associated with a 0.76 percentage point increase in Wisconsin employment (R2 of 0.41). (SPF forecast interpolated to to monthly via quadratic match.)One can reasonably ask if the BLS/DWD series is mismeasuring employment due to problems with the firm birth/death model, etc. The Philadelphia Fed provides an alternative estimate based on QCEW data through Q3. This series is even higher than the official series.
 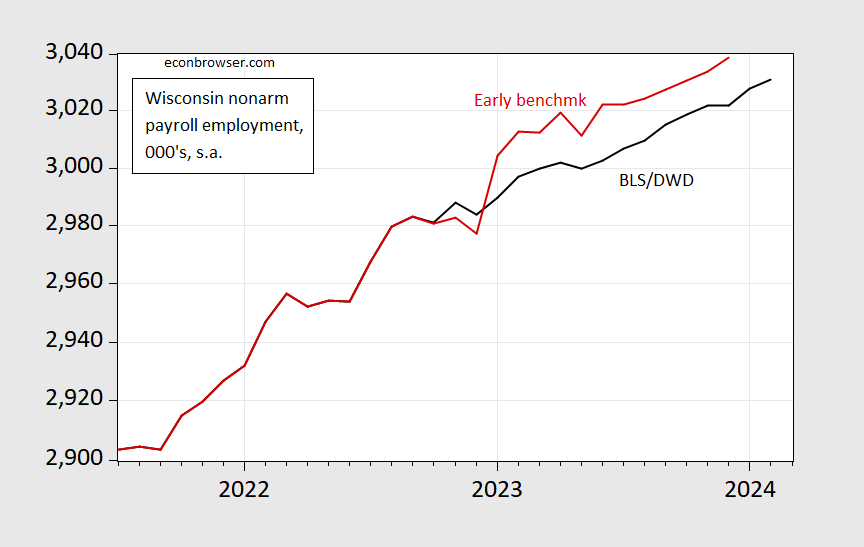 Figure 2: Wisconsin nonfarm payroll employment (black), Philadelphia Fed early benchmark series (red), 000’s, s.a. Source: DWD,Philadelphia Fed.Through the end of 2023, the Philadelphia Fed series shows 2% y/y growth, compared to 1.3% using the official series.Finally, construction employment has slowed its torrid pace in February.
 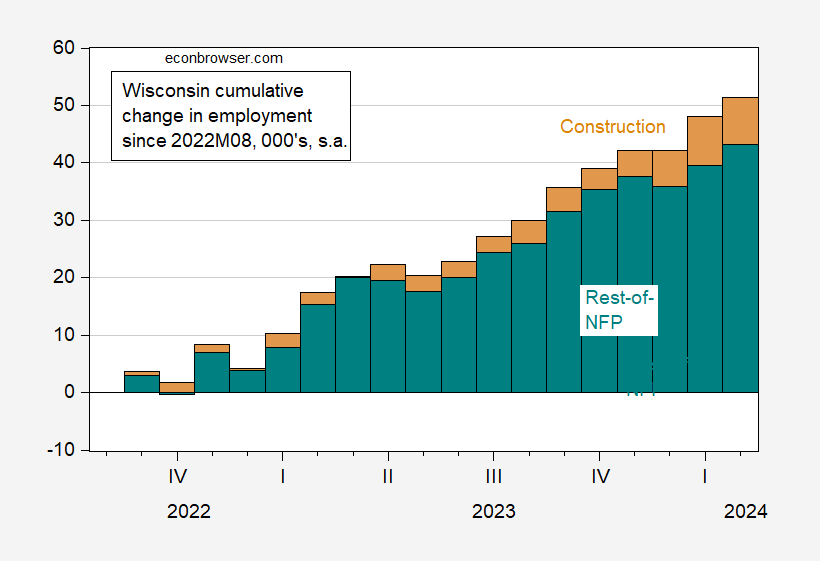 Figure 3: Wisconsin cumulative change in construction employment (tan), and in rest-of-NFP (teal) since 2022M08, in 000’s, s.a. Source: DWD and author’s calculations.More By This Author:Are You Better Off Than You Were 4 Years Ago FOMC March SEP On GDPIs The Fed Looking At FAIT? If So, What Would It Imply?