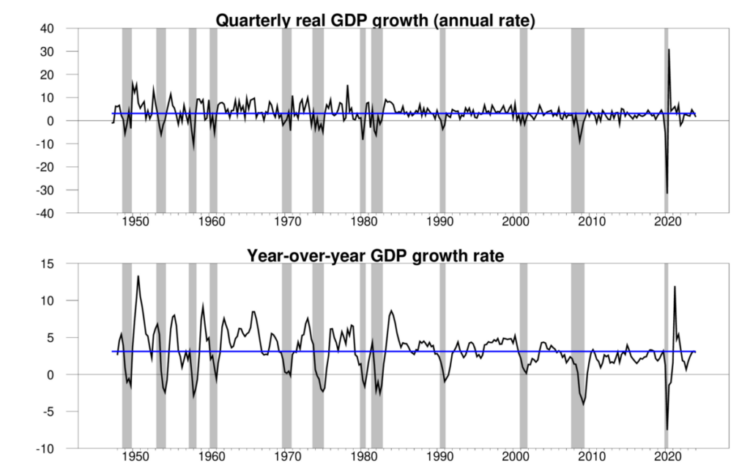
The Bureau of Economic Analysis announced today that seasonally adjusted U.S. real GDP grew at a 1.6% annual rate in the first quarter. That’s a little lower than many analysts expected. But the year-over-year growth is still on track.
Top panel: quarterly real GDP growth at an annual rate, 1947:Q2-2024:Q1, with the historical average (3.1%) in blue. Calculated as 400 times the difference in the natural log of real GDP from the previous quarter. Bottom panel: year-over-year growth rate. Calculated as 100 times the difference in the natural log of real GDP from the same quarter of the previous year.The new numbers put the Econbrowser recession indicator index at 2.0%, a very low level, indicating unambiguous continuation of the economic expansion that began in 2020:Q3.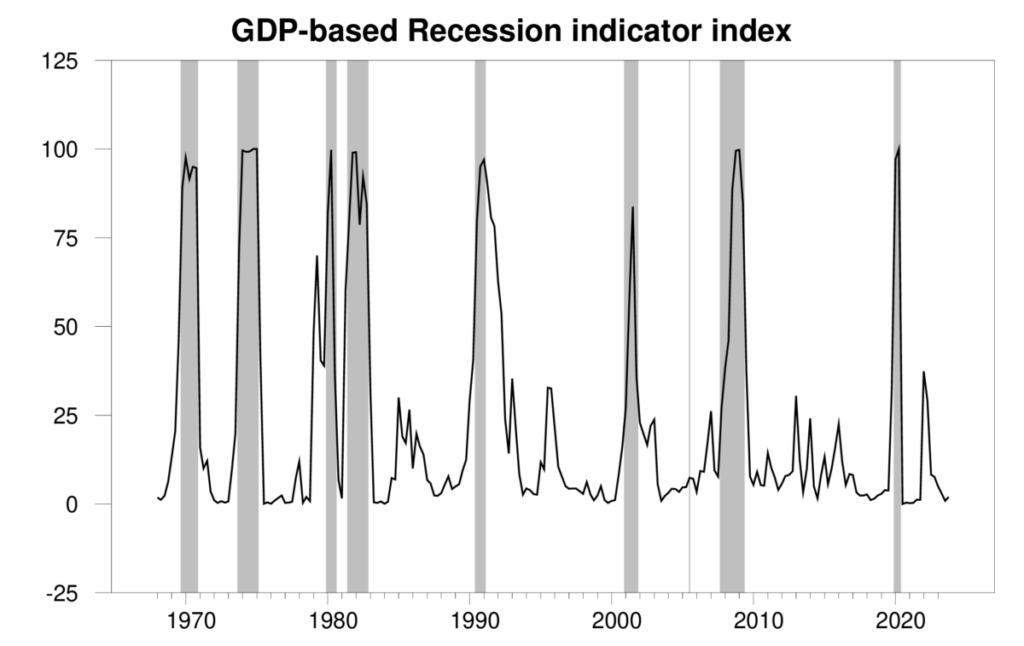
GDP-based recession indicator index. The plotted value for each date is based solely on the GDP numbers that were publicly available as of one quarter after the indicated date, with 2023:Q4 the last date shown on the graph. Shaded regions represent the NBER’s dates for recessions, which dates were not used in any way in constructing the index.A key factor in the weaker GDP growth was a surge in imports, which are subtracted in calculating GDP. The import estimates are volatile and can be subject to revision.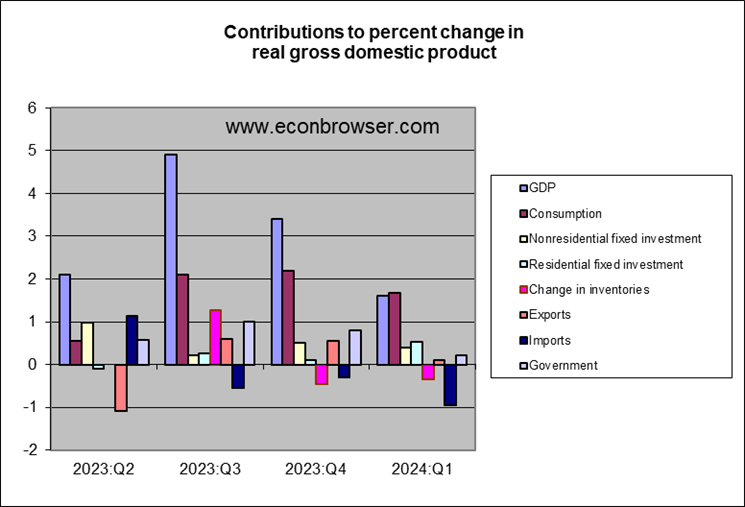
Residential fixed investment made a nice contribution to Q1 GDP growth, despite high interest rates. Mortgage rates had come down between November and February but have moved partly back up since then.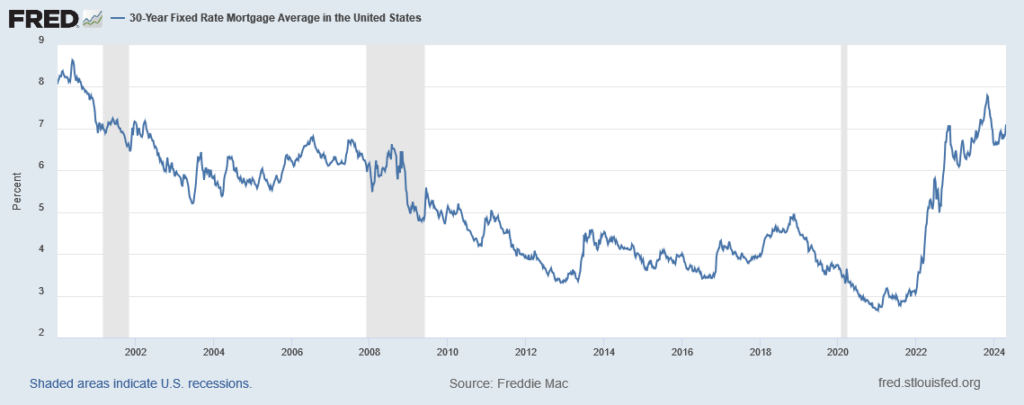
The explanation for the recent uptick in mortgage rates is that the Fed has not made as much progress at bringing inflation down as many had hoped. The new GDP report is a little disappointing there as well. The implicit PCE deflator increased at a 3.3% annual rate in the first quarter. The year-over-year rate was 2.5% — a little better than the quarterly increase, but still above the Fed’s 2% target.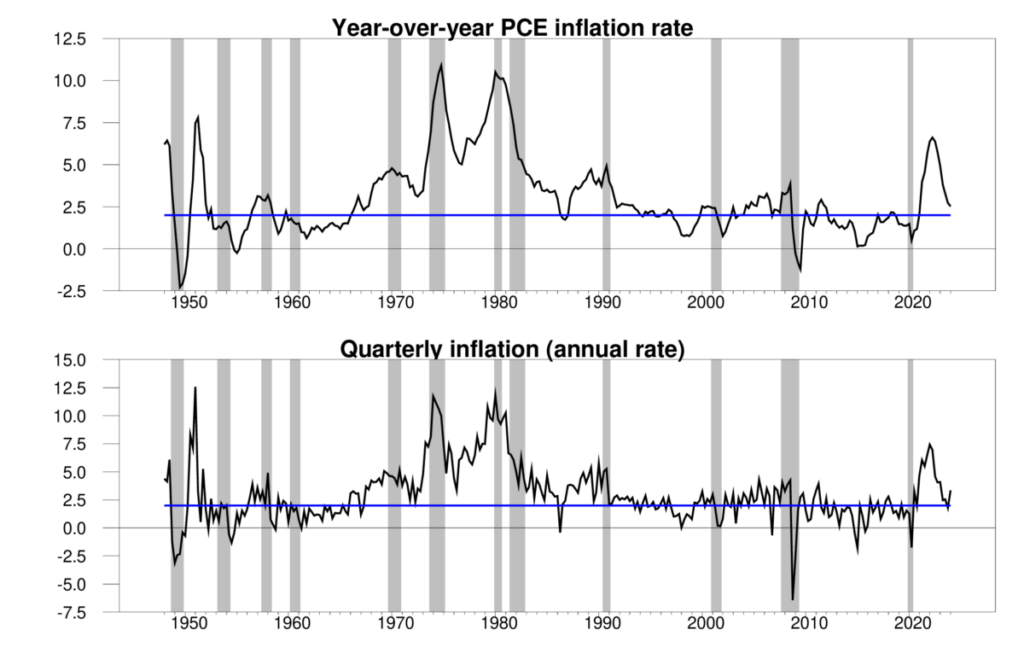
Top panel: 100 times the difference in the natural log of the implicit price deflator on personal consumption expenditures from the same quarter of the previous year. Bottom panel: 400 times the difference in the natural log of the PCE deflator from the value the previous quarter.The absence of further progress on inflation has resulted in a big shift in market expectations about the Fed’s next moves. At the start of December 2023, the futures contract for the December 2024 fed funds rate was 4.3%, consistent with four 25-basis-point cuts in the fed funds rate this year. Right now the contract implies a 5% rate in December. Traders are now anticipating only one cut, and that not coming until later in the year.Several supply-side factors also have the potential to bump up the inflation rate. The two presidential candidates seem to be competing to see who will increase the prices of imported goods the most. Geopolitical riks could bring higher energy prices. And measures like California’s $20 minimum wage for fast-food workers cannot help.It continues to appear that the Federal Reserve has carried off the coveted “soft landing,” bringing inflation down without a recession. But I have to admit that the plane is not quite on the ground just yet.More By This Author:The Value Of The Chinese Yuan: Down 15% Since 2022M03Real Median Household Income For March Business Cycle Indicators, Mid-April