 Image Source: Pixabay
The EUR/USD currency pairTechnical indicators of the currency pair:
ECB policymakers’ statements hint at a willingness to start reducing borrowing costs as early as June, with some officials suggesting the possibility of three rate cuts before the end of 2024. With the June meeting seen as a done deal, talk has already turned to a second-rate cut, with some discussing a July meeting. This has put pressure on the single currency in recent weeks, and with the Fed now believing that rates will be cut much later this year, EUR/USD will find it difficult to move upwards.Trading recommendations
The trend on the EUR/USD currency pair on the hourly time frame is bearish. The European currency unexpectedly found support near 1.0610 on Friday. The price was sharply repurchased, and two buy zones were formed to support the price. There is weak buying pressure intraday. Under these market conditions, buy trades should be considered from the 1.0630–1.0640 area. For buyers, keep the price above 1.0630; otherwise, a decline to 1.0590 will be inevitable. The resistance level of 1.0686 can be considered for selling, provided the sellers react.Alternative scenario: if the price breaks the resistance level of 1.0756 and consolidates above it, the uptrend will likely resume. 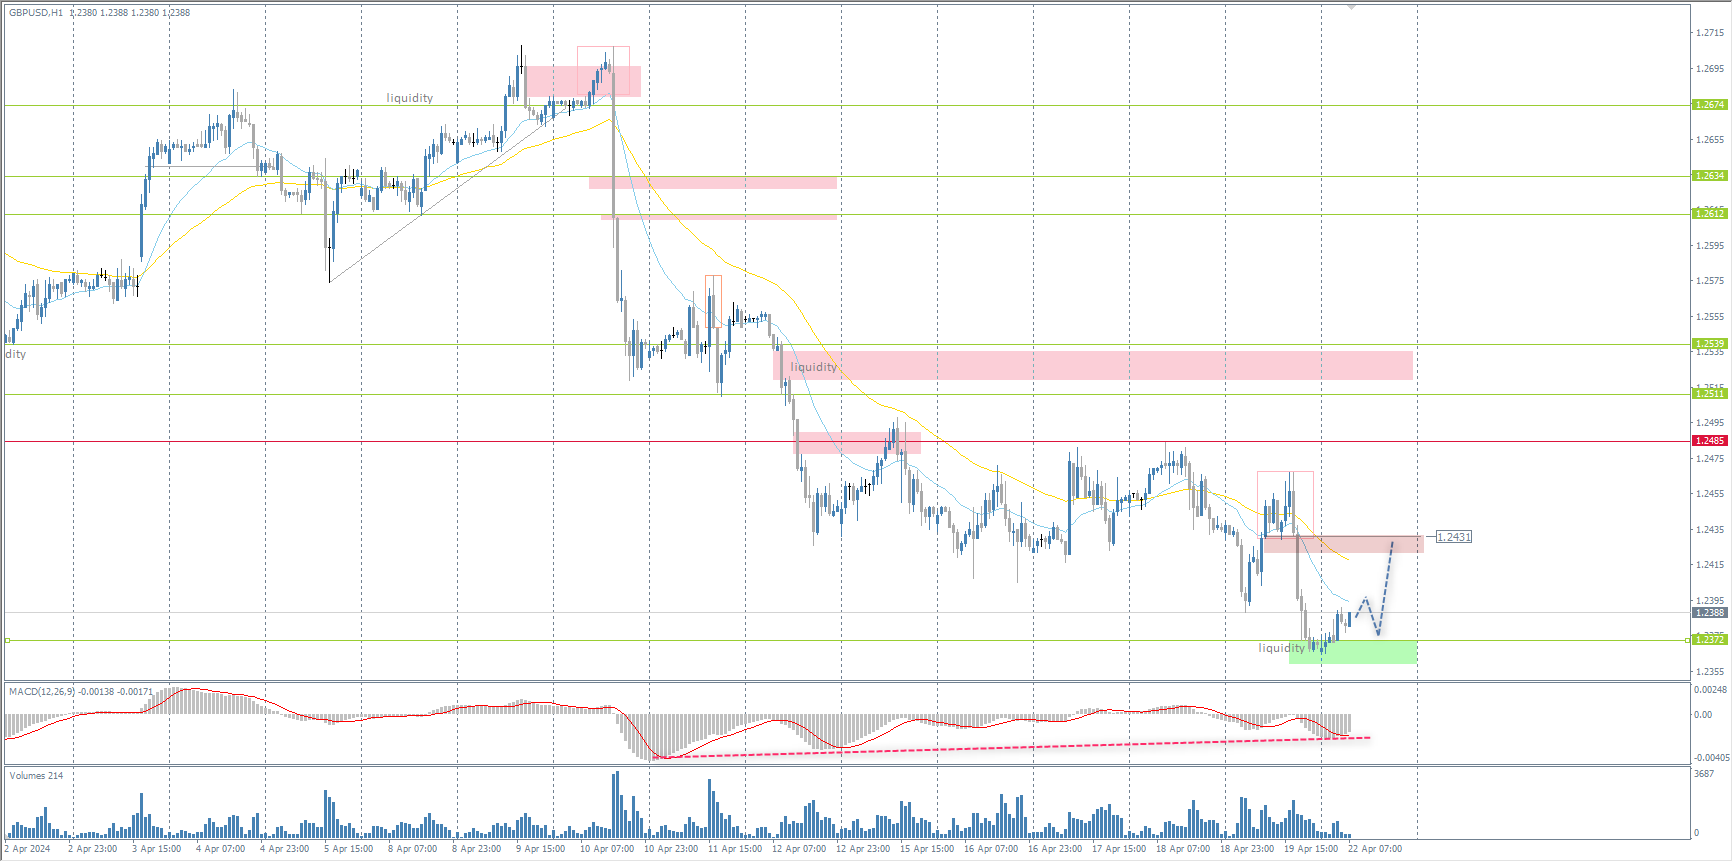 News feed for 2024.04.22:
The GBP/USD currency pairTechnical indicators of the currency pair:
After disappointing UK retail sales data, the British pound stopped at nearly $1.24, remaining at its lowest since mid-November. Retail sales unexpectedly stagnated in March, reflecting weak consumer spending, and the country’s inflation rate fell less than expected to 3.2%, the lowest level since September 2021. Bank of England policymaker Megan Greene warned that the latest UK data on wage growth and service price inflation are too inflated for the central bank to consider cutting interest rates.Trading recommendations
From the point of view of technical analysis, the trend on the GBP/USD currency pair on the hourly time frame is bearish. The price has reached areas of liquidity below 1.2373, where buyers have shown a reaction. Intraday, there is a change in structure. Technically, the price is oversold, as evidenced by the deep divergence on the MACD indicator. Under such market conditions, buy trades can be considered at current prices and from the demand zone below 1.2372. The minimum upside target is the resistance level at 1.2431. There are no optimal entry points for selling right now.Alternative scenario: if the price breaks through the resistance level of 1.2485 and consolidates above it, the uptrend will likely resume.  There is no news feed today.
The USD/JPY currency pairTechnical indicators of the currency pair:
The Japanese yen briefly rose to 154 per dollar, rebounding slightly from 34-year lows. Bank of Japan Governor Kazuo Ueda said the central bank will likely raise interest rates if core inflation rises and large-scale bond purchases begin to scale back in the future. He added that in its quarterly growth and price forecasts, presented at a policy meeting this week, the BoJ will show how the weakening yen has affected the economy. Concerns about government intervention also supported the yen after top finance officials from the US, Japan, and South Korea agreed to coordinate on currency markets. Meanwhile, robust US data and hawkish comments from the Fed pushed the dollar up, with the yen again trading at multi-year highs.Trading recommendations
From a technical point of view, the medium-term trend on the currency pair USD/JPY is bullish. The support level 153.95 has prevented the price from consolidating below for the fourth time. The latest volume spike showed a bullish reaction, which indicates either a partial closing of positions or a new loading for further price growth, which is less likely. With the most substantial divergence on the MACD and price again trading at intervention levels, the 154.50–155.00 zone should still be considered a strong selling zone. Under these market conditions, buying is highly undesirable, and selling is still early as sellers need to show initiative.Alternative scenario: if the price breaks and consolidates below the support level of 152.58, the downtrend will likely resume. 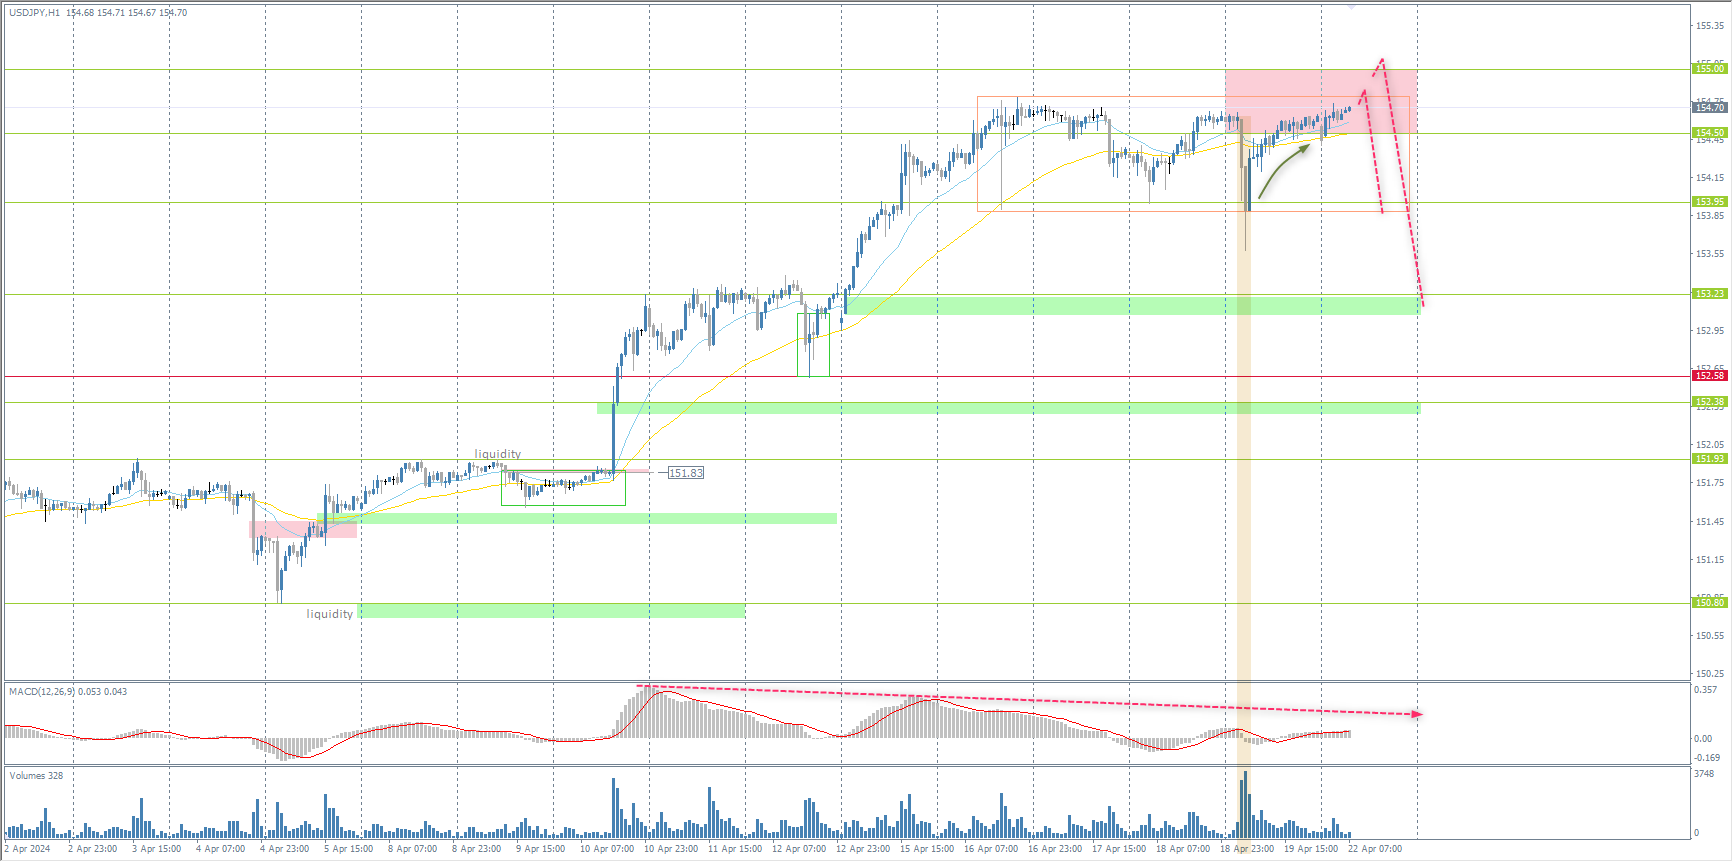 There is no news feed today.
The XAU/USD currency pair (gold)Technical indicators of the currency pair:
Gold fell below $2,380 an ounce on Monday, retreating from last week’s record highs, amid easing tensions in the Middle East. Israel launched a missile attack on Iran last Friday, prompting investors to flee to safer assets. But sources said the scope of the attack may have been limited and that Iran downplayed Israel’s response, allaying fears that the conflict could escalate into a wider war. Nevertheless, investors are keeping a close eye on further developments. Expectations of continued restrictive interest rates pressure gold, as the attractiveness of non-income-producing assets, such as gold, declines when rates rise.Trading recommendations
From the point of view of technical analysis, the trend on the XAU/USD is bullish. The price has formed a flat accumulation with the boundaries of 2363–2400. The rule of working in a flat is quite simple: sell from the upper boundary and buy from the lower boundary. However, it is also important to see confirmation in the form of an initiative or a false breakout/breakdown. Now, the price is testing the lower boundary of the flat, but the reaction of buyers is weak, so there is a high probability of testing the liquidity below 2363. If buyers take the initiative, it is possible to look for buy trades. If the price consolidates below 2363, there is a high probability of a sell-off.Alternative scenario: if the price breaks below the support at 2319, the downtrend will likely resume. 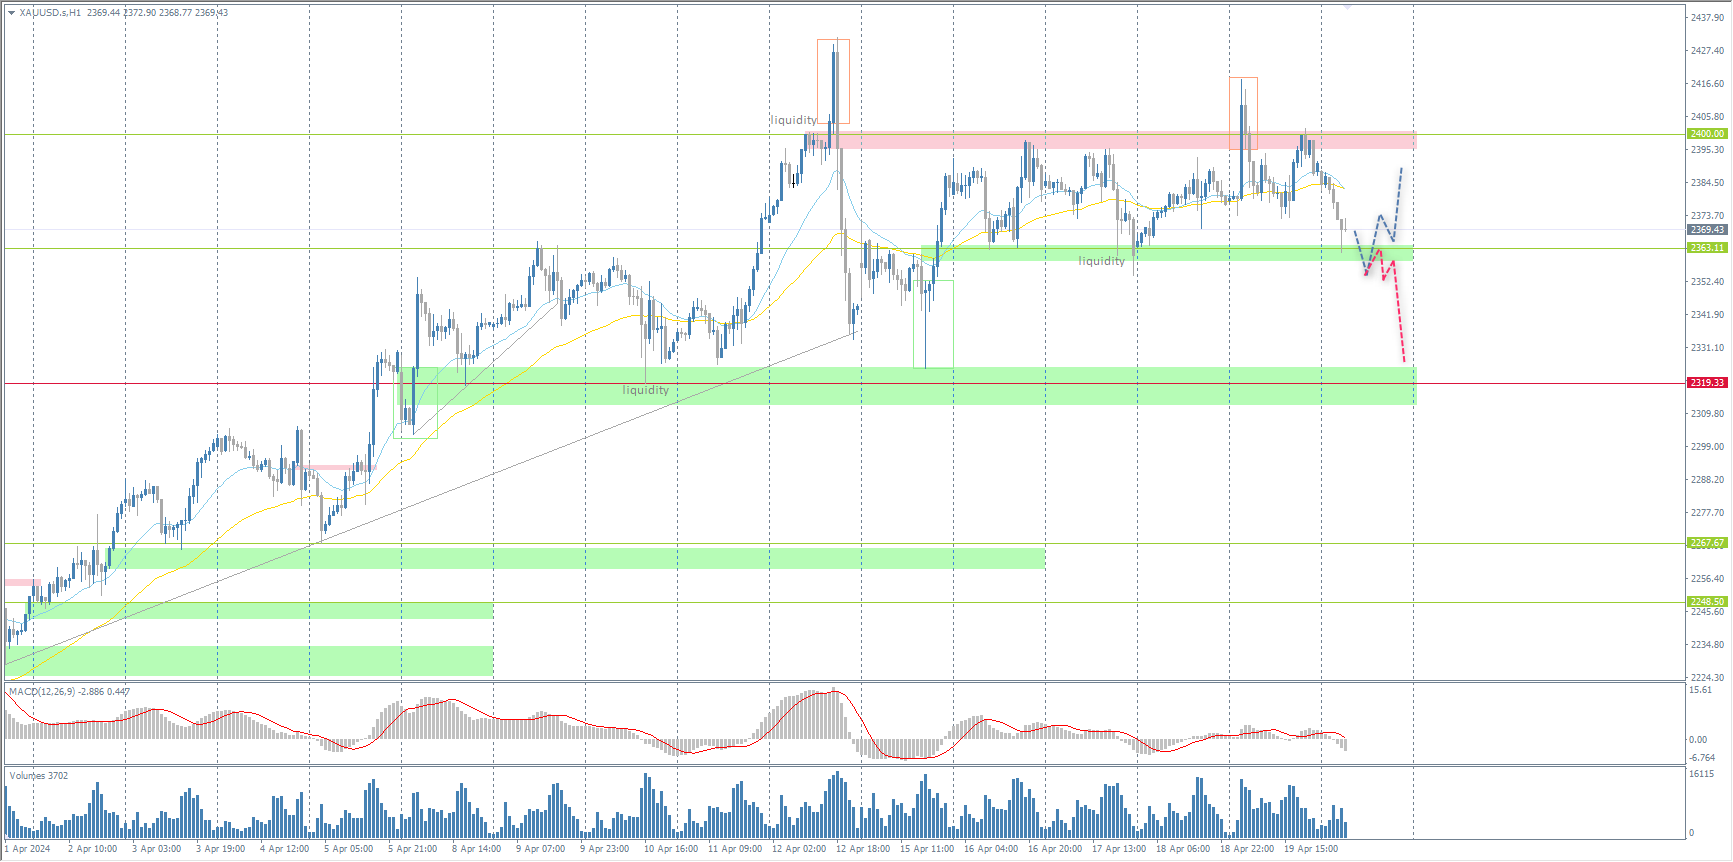 There is no news feed today.More By This Author:China Kept Interest Rates At Lows Analytical Overview Of The Main Currency Pairs – Friday, April 19Israel Has Retaliated Against Iran; Investors Run To Safe Assets