
 Image Source: Pixabay
The EUR/USD currency pairTechnical indicators of the currency pair:
On Wednesday, the euro strengthened after the IFO German Business Climate Index rose more than expected to an 11-month high for April. Also bullish for the euro were hawkish comments from ECB Governing Council representative Nagel, who said an ECB rate cut in June does not necessarily mark the start of a series of rate cuts. Swaps put the odds of a 25 bps ECB rate cut at the next meeting on June 6 at 84%, while the odds of a June rate cut from the US Fed are 19%. And this differential of expectations will put pressure on the euro in the medium term.Trading recommendations
The trend on the EUR/USD currency pair on the hourly time frame is bearish. The euro growth slowed slightly after the price held above the 1.0689 mark. Volatility is declining ahead of important PCE inflation data on Friday. The MACD indicates a decrease in the activity of buyers. With a high probability, the corrective growth will continue. The target is to test liquidity above 1.0722 or 1.0756. Under such market conditions, buy trades can be considered from the demand zone below 1.0675–1.0686, provided buyers react correctly. A price fixing below 1.0675 will bring the bearish initiative back to the market.Alternative scenario: if the price breaks the resistance level of 1.0756 and consolidates above it, the uptrend will likely resume. 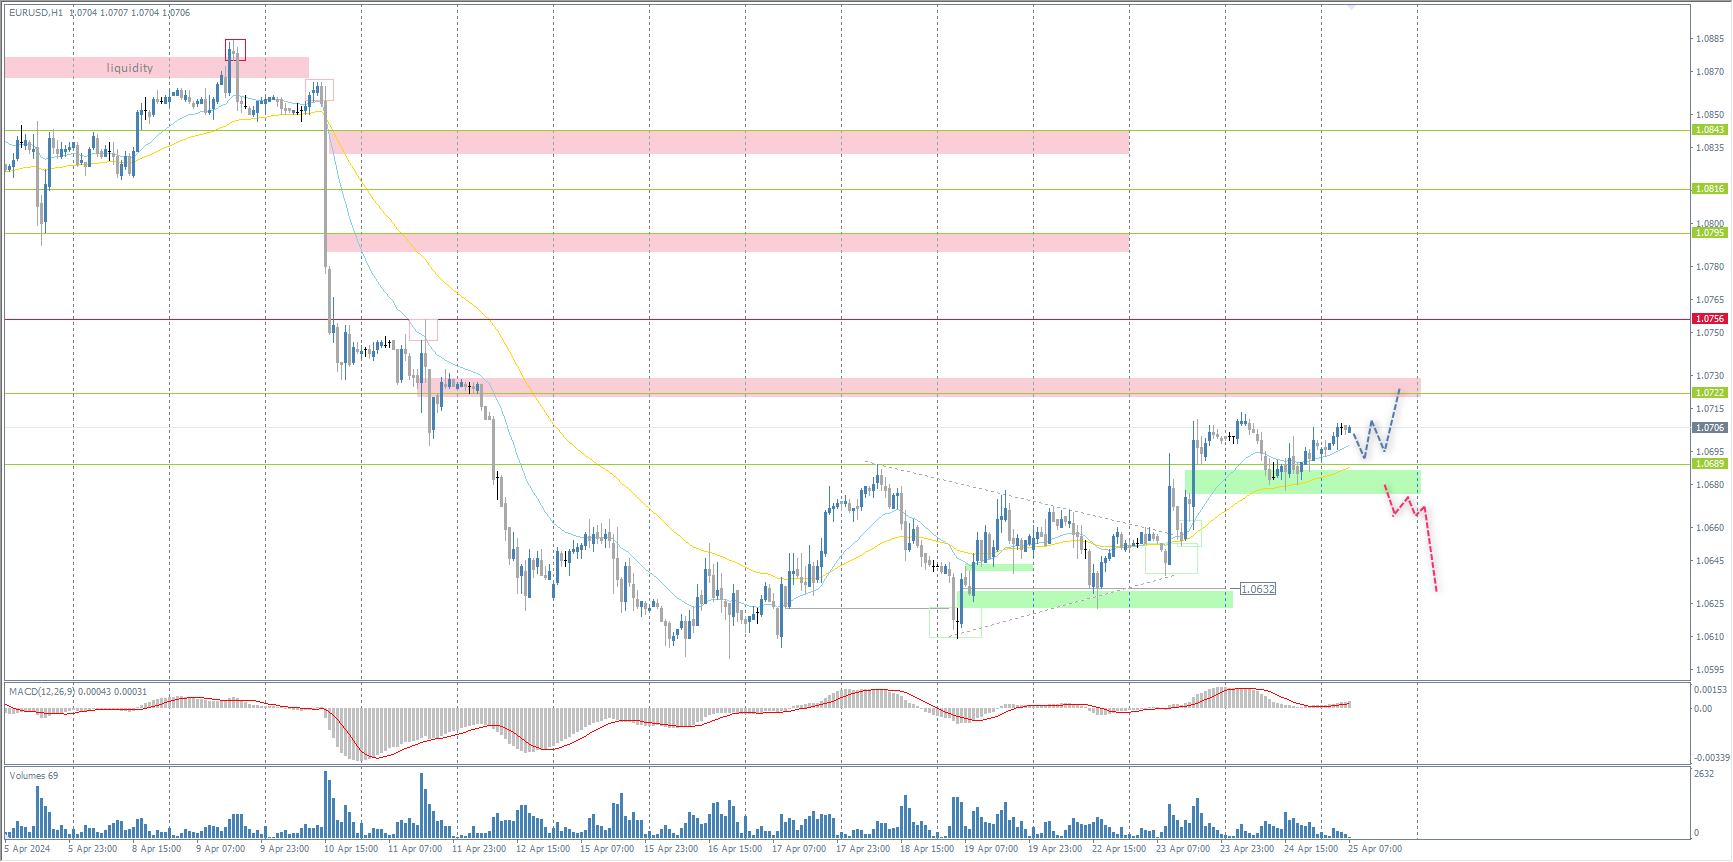 News feed for 2024.04.25:
The GBP/USD currency pairTechnical indicators of the currency pair:
The British pound rose against the US dollar yesterday, although the overall downtrend remains driven by diverging monetary policy expectations. Initially, forecasts for a UK interest rate cut were put off. Sterling was once a clear outlier as UK inflation remained stubbornly higher than its peer countries. However, things have changed, and the market is confident that the Bank of England will start cutting interest rates in August.Trading recommendations
From the point of view of technical analysis, the trend on the GBP/USD currency pair on the hourly time frame is bearish. However, the price is approaching the level of priority change. During the corrective growth, the price formed 2 demand zones to keep the price from falling. These are the zone below 1.2424 and the zone below 1.2381. Now, the price is trading above the moving averages. The MACD indicates weak buying pressure. With a high probability, the price will test liquidity above 1.2485. Under such market conditions, buy trades can be sought from the midlines or the support level at 1.2424, provided the buyers react correctly. The 1.2485 priority level can be considered for sell deals, provided sellers start actively defending their positions.Alternative scenario: if the price breaks through the resistance level of 1.2485 and consolidates above it, the uptrend will likely resume. 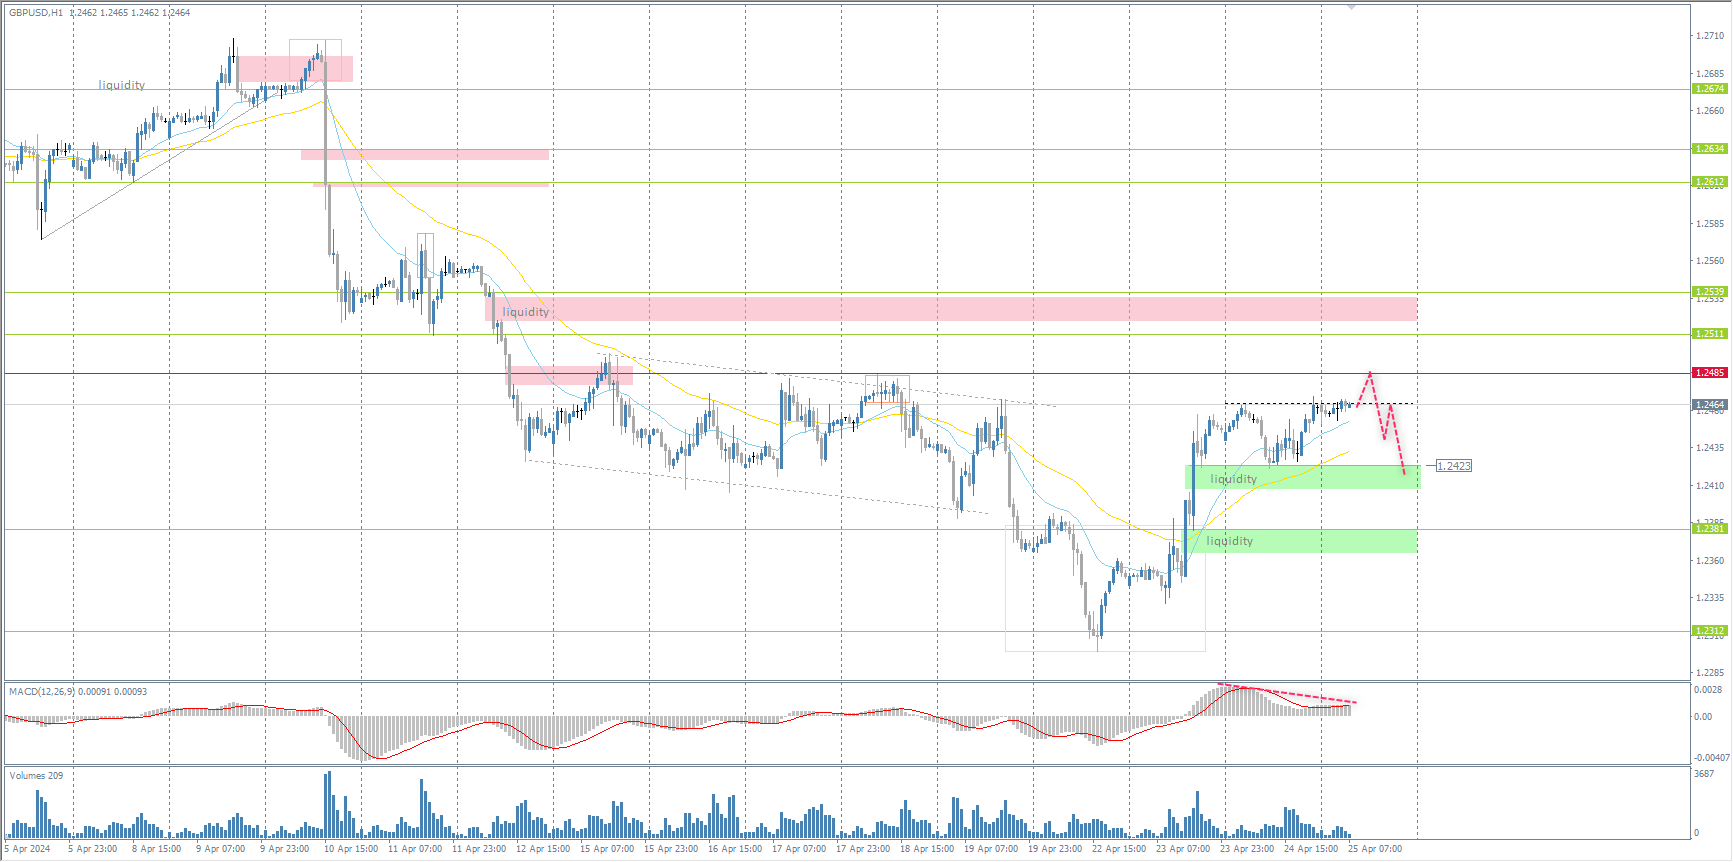 There is no news feed today.
The USD/JPY currency pairTechnical indicators of the currency pair:
On Wednesday, the Nikkei Stock Index’s positive 2% rally reduced demand for the yen as a haven asset. Japanese authorities could intervene in the currency market at any time to support the exchange rate. But most likely, the Bank of Japan will not intervene in the middle of the week. Therefore, at tomorrow’s monetary policy meeting of the Bank of Japan, we may be in for surprises in the form of intervention. Swaps estimate the odds of a BoJ rate hike at 0 bps at 1% at the April 26 meeting and 36% at the next meeting on June 14.Trading recommendations
From a technical point of view, the medium-term trend of the currency pair USD/JPY is bullish. The price is trading at historical highs in the area, where there is a high probability of the Bank of Japan’s intervention. The long consolidation ended with a bullish impulse, meaning most market participants were trying to sell. The price is rising on the liquidation of these sell positions. Now, the price has reached the psychological mark of 155.50. Indicators are overbought, but there is still room for growth. Under such market conditions, we can consider short-term buy deals from the support level of 155.36, but only with confirmation. Without confirmation, the price may go flat again before tomorrow’s BoJ meeting.Alternative scenario: if the price breaks and consolidates below the support level of 154.55, the downtrend will likely resume. 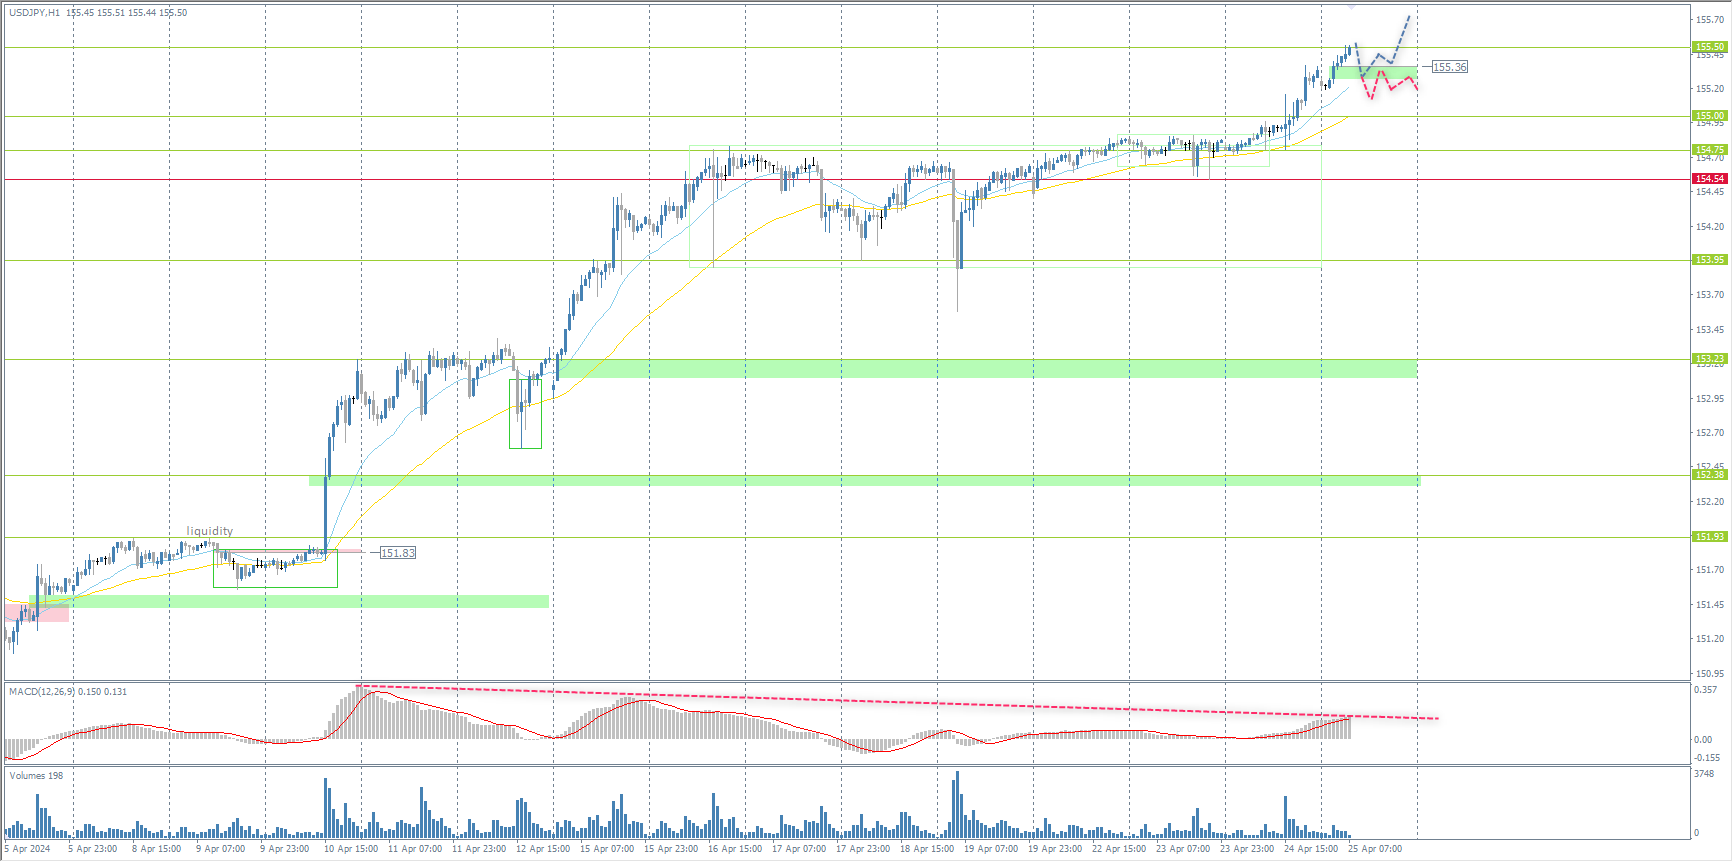 There is no news feed today.
The XAU/USD currency pair (gold)Technical indicators of the currency pair:
The strengthening of the dollar on Wednesday became a bearish factor for precious metals. Durable goods orders in March slightly beat expectations, but Tuesday’s S&P PMI data pointed to a slowdown in the US private sector. Markets now await the preliminary GDP estimate and PCE inflation data for more clarity on the extent and scope of the Fed’s interest rate cuts. Previously hawkish Fed language and rising prices have led investors to lower their expectations for rate cuts this year, reducing the attractiveness of non-income-producing assets.Trading recommendations
From the point of view of technical analysis, the trend on the XAU/USD is bearish. On Tuesday, the 2292 support level showed the presence of a big buyer. This level was respected by the price earlier, forming a double bottom. Now, the price is trading at the level of moving averages, creating a narrow, flat accumulation. The price is likely to test the liquidity zone above 2350. Under such market conditions, buyers may look for trades from the 2314 level but with confirmation. A price fixing below 2300 may trigger a new wave of sell-offs.Alternative scenario: if the price breaks and consolidates above the resistance level of 2400, the uptrend will likely resume. 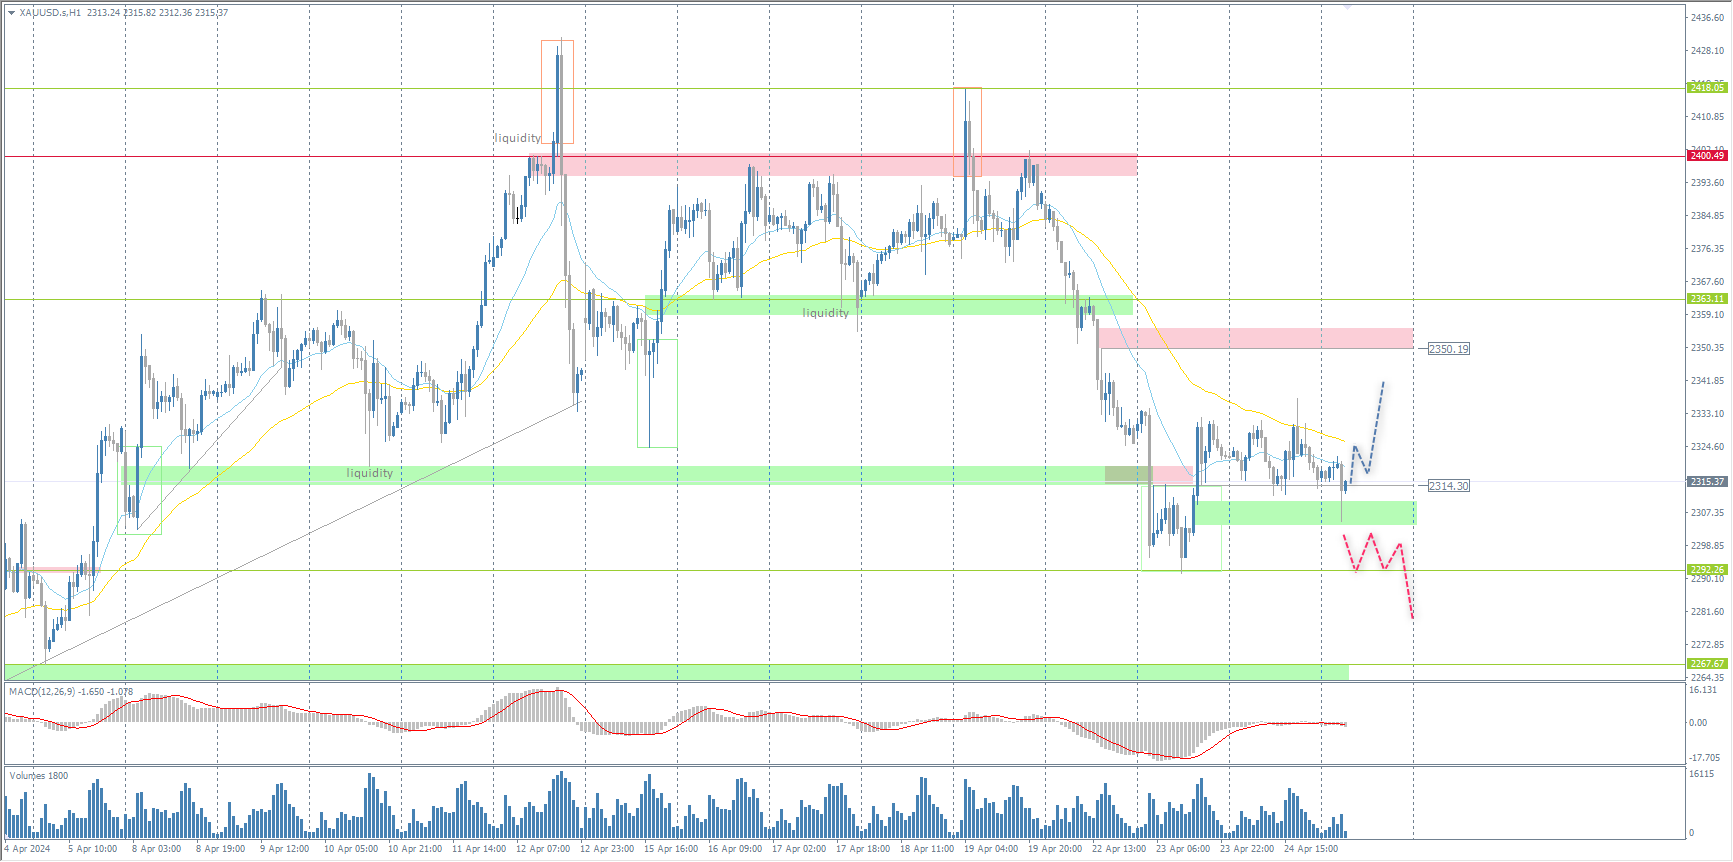 News feed for 2024.04.25:
More By This Author:QCOM Wants To Create Competition In The AI Chip Market Analytical Overview Of The Main Currency Pairs – Wednesday, April 24Tesla Shares Rose On A Weak Report. Inflationary Pressures Are Easing In Australia