AUDUSD Elliott Wave Analysis Trading Lounge Day Chart, Wednesday, April 24  PixabayAustralian Dollar/U.S. Dollar (AUDUSD) Day Chart AUDUSD Elliott Wave Technical Analysis FUNCTION: Counter Trend MODE: impulsive as A STRUCTURE: blue wave 3 POSITION: black wave B DIRECTION NEXT HIGHER DEGREES: black wave B DETAILS: blue wave 2 completed , now blue wave 3 of Ais in play .Wave Cancel invalid level: 0.64440 The AUD/USD Elliott Wave Analysis for the Day Chart provides an in-depth examination of the trends and expected future movements in the Australian Dollar/U.S. Dollar currency pair according to Elliott Wave Theory. FunctionThe function of the analysis is identified as “Counter Trend.” This designation indicates that the current wave structure is moving against the broader trend. In other words, while the overall market direction may be trending in one way, the current analysis focuses on a temporary reversal or correction against that prevailing trend. ModeThe mode for this chart is described as “impulsive as A.” This designation signifies that the ongoing wave is impulsive, suggesting strong momentum, yet is part of a corrective phase. The impulse often initiates a new corrective wave or drives a significant move within the larger wave structure. StructureThe structure is defined as “blue wave 3.” This structure is indicative of an intermediate-level wave within a corrective cycle. Blue wave 3 of A generally suggests that a significant impulsive phase is occurring within a broader counter-trend movement. PositionThe position within the Elliott Wave structure is noted as “black wave B.” This placement suggests that the current wave structure is part of a larger corrective phase, possibly indicating a retracement or consolidation pattern within a higher degree of correction.Direction for the Next Higher DegreesThe analysis highlights the “black wave B” as the expected direction at higher degrees. This reference indicates that the current impulsive phase will eventually lead to a larger corrective movement, often resembling a multi-level pattern in Elliott Wave Theory. DetailsThe details state that blue wave 2 has completed, and blue wave 3 of A is now in play. This transition indicates a move from a corrective phase to an impulsive one. The Wave Cancel invalid level is 0.64440, implying that if the price moves beyond this point, the current wave structure will require reassessment, signaling a potential invalidation of the wave count. In summary, the AUD/USD Elliott Wave Analysis for the Day Chart reveals a complex corrective phase within a larger counter-trend pattern. Blue wave 3 of A is underway, indicating an impulsive phase within a broader correction, with a Wave Cancel invalid level providing a crucial marker for risk management. This analysis suggests that the trend may continue to develop, leading to more intricate wave structures within the larger Elliott Wave framework.
 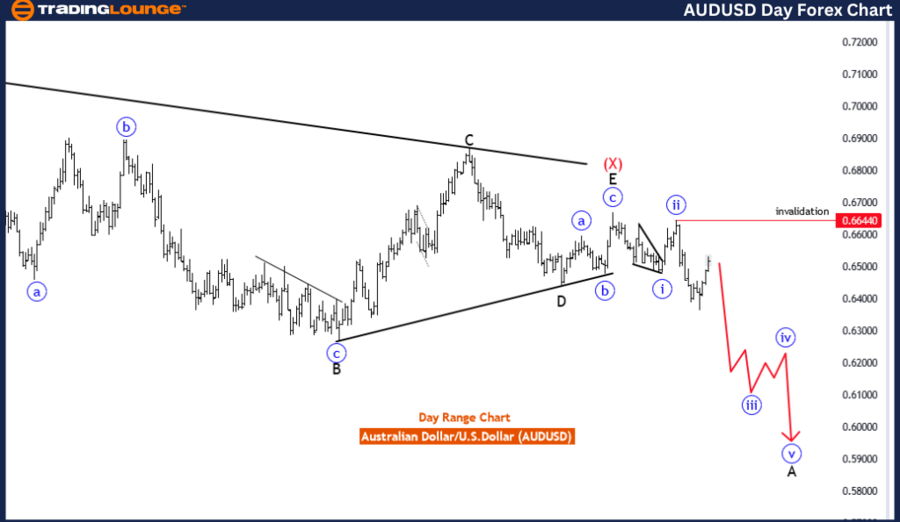 AUDUSD Elliott Wave Analysis Trading Lounge 4 Hour Chart, Australian Dollar/U.S. Dollar (AUDUSD) 4 Hour Chart AUDUSD Elliott Wave Technical AnalysisAUDUSD Elliott Wave Technical Analysis FUNCTION: Trend MODE: corrective STRUCTURE: red wave 2 POSITION: blue wave 3 DIRECTION NEXT LOWER DEGREES: red wave 3 DETAILS: red wave 2 is in play and looking near to end between 50.00 to 61.80 fib level .Wave Cancel invalid level: 0.64440 The AUD/USD Elliott Wave Analysis for the 4-Hour Chart examines the current trends and likely future direction of the Australian Dollar/U.S. Dollar currency pair based on Elliott Wave Theory. FunctionThe function of this analysis is identified as “Trend,” indicating that the wave structure being analyzed is part of a broader ongoing trend rather than a counter-trend or corrective move. This classification signifies that the current pattern is likely to align with a larger directional movement. ModeThe mode for this chart is described as “corrective.” Although the overall function is a trend, the current wave structure is correcting within that trend. Corrective waves usually follow an impulsive phase, indicating a retracement or a consolidation phase within the ongoing trend. StructureThe structure is defined as “red wave 2.” This wave typically represents a correction within a larger impulsive structure. It suggests that the current corrective phase is an intermediate step in a more significant trend, often occurring after an impulsive wave has completed. ### PositionThe current position within the Elliott Wave structure is “blue wave 3.” This position points towards an intermediate-degree wave pattern, often indicating a larger wave in the multi-level structure of Elliott Waves. The presence of a corrective structure within a blue wave 3 suggests a potential pause in a broader upward or downward trend. ### Direction for the Next Lower DegreesThe analysis points towards “red wave 3” as the next lower-degree trend. This indication aligns with the structure’s corrective mode, suggesting that once the current red wave 2 concludes, a new impulsive movement is likely to begin in the form of red wave 3. DetailsThe analysis states that red wave 2 is nearing its end, falling between the 50.00 and 61.80 Fibonacci retracement levels. These levels are significant as they often serve as key support or resistance zones where reversals may occur. The Wave Cancel invalid level is at 0.64440, indicating that if the price moves beyond this point, the current wave structure may be invalidated, requiring re-evaluation.In summary, the AUD/USD Elliott Wave Analysis for the 4-Hour Chart outlines a current corrective phase within a broader trend. It suggests that once red wave 2 concludes, an impulsive red wave 3 is likely to begin, indicating a potential shift in market direction. The Fibonacci retracement levels offer guidance on where this correction might end, while the invalidation level provides a critical risk boundary for traders and analysts. Technical Analyst: Malik Awais Source: Tradinglounge.com
 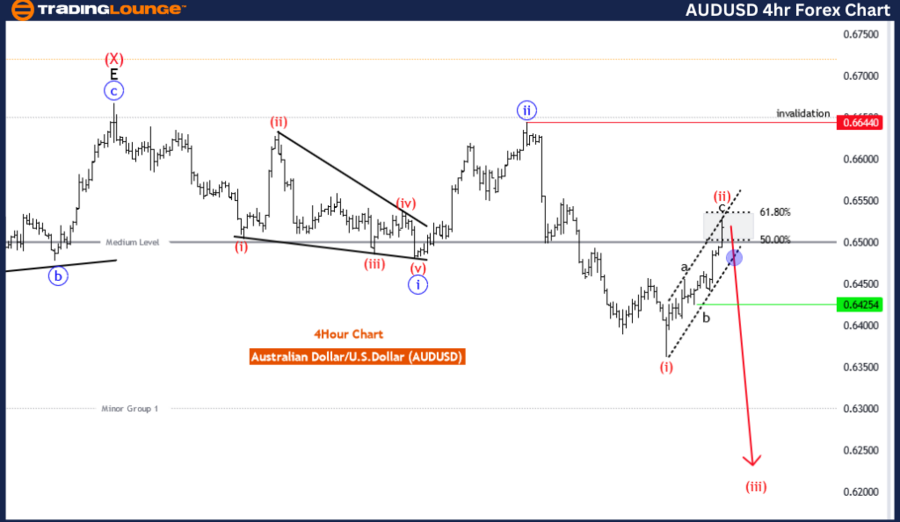 More By This Author:Elliott Wave Technical Analysis: Theta Token Crypto Price News
Elliott Wave Forecast: Identifying Opportunities In Commodity Trading
Elliott Wave Technical Analysis: Analog Devices Inc. – Tuesday, April 23