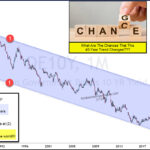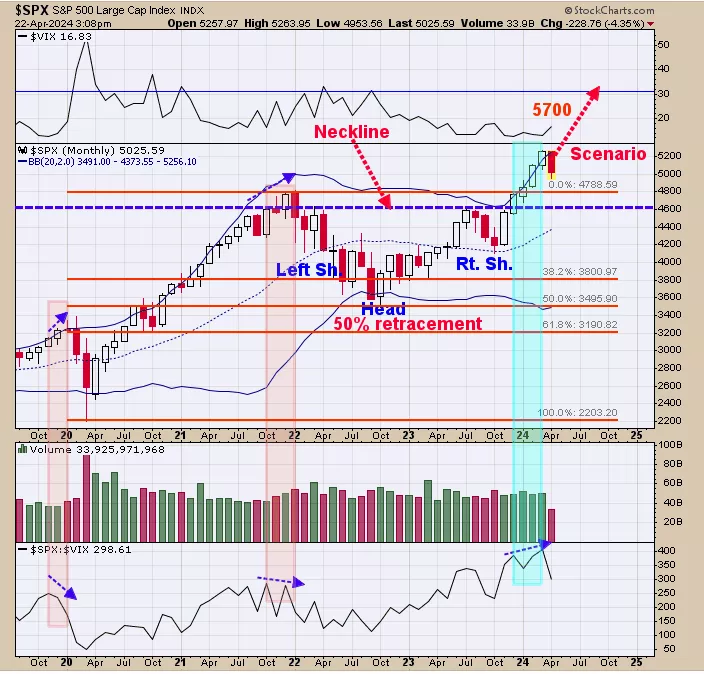
SPX Monitoring purposes; Long SPX 4/12/24 at 5123.41.Our Gain 1/1/23 to 12/31/23 SPX= 28.12%; SPX gain 23.38%Monitoring purposes GOLD: Long GDX on 10/9/20 at 40.78. Our gain for 2023 came in at 28.12% and SPX gain for 2023 came in at 23.38. We made 8 SPX trades with one loss and 7 wins in 2023.Above is the monthly SPX and in the bottom window is the monthly SPX/VIX ratio. Normally when the market nears an intermediate-term high the VIX will start to rise as it anticipates a high in the market. Notice going into the February 2020 (COVID high); the SPX was still making higher highs as the SPX/VIX ratio was making lower highs. The same thing happens at late 2021 high (shaded in light pink for both years). At the recent high both the SPX and VIX where making higher highs and no divergence showed up (shaded in light blue). We have shown this chart in the past and pointed out the bullish Head and Shoulders bottom which had a measured target near 5700 SPX range; at the moment that still seems likely. What would spoil that outlook would be going forward the SPX makes higher highs and the VIX fails to make higher highs. A bullish picture remains likely.
 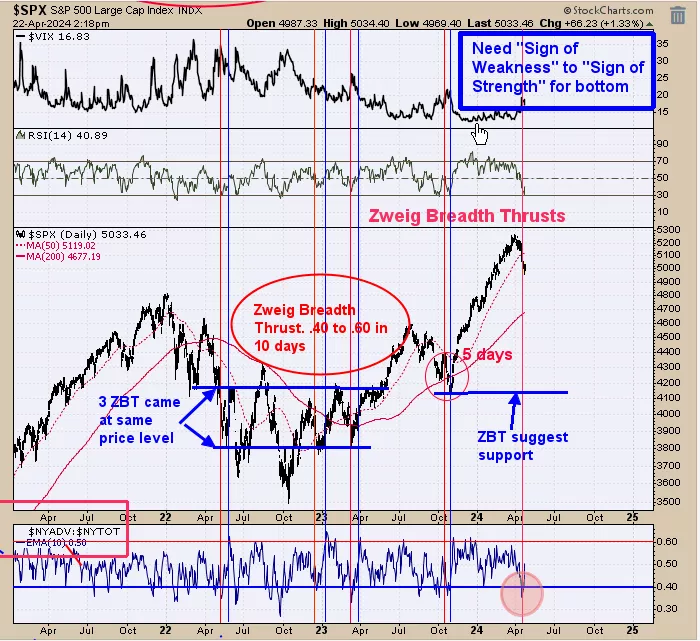 Not sure if this chart will “kick in” but if it does would be a bullish sign. Above is the Zweig Breath Thrust indicator (ZBT); bottom window. The ZBT is triggered when the NYSE Advance/NYSE total with a 10-day moving average falls below .40 and then rallies to .60 in ten days or less. It’s a bullish sign for the market going forward. ZBT has turned up from below .40 on April 18 and now stands at +.50. It would need to reach .60 on May 1 (next Wednesday) or before. Evidence suggests the bigger trend is still up for the market and another 10% or more is possible before the year end.
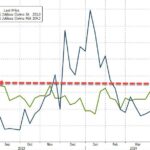
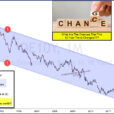
 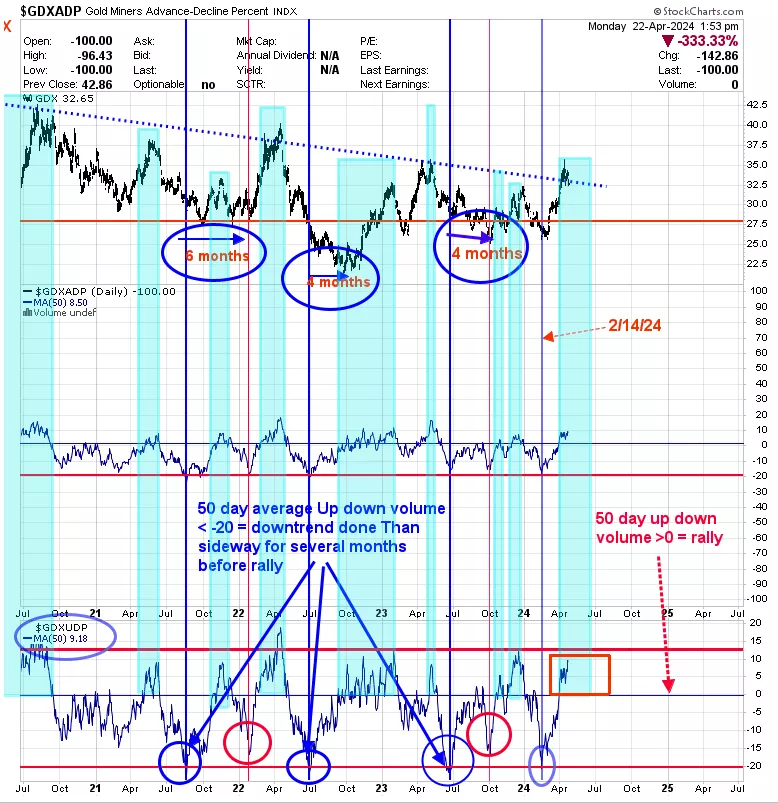 The bottom window is the GDX Up Down volume indicator with a 50-day average. The top window is the daily GDX. This indicator is good for finding the trend for GDX. When this indicator is above “0”, GDX is considered in an uptrend, and below “0” a downtrend. We marked in light blue when this indicator was above “0” which in turn an uptrend was in force for GDX. This indicator closed above “0” in late March (low came in early March) so it’s not designed to catch the bottoms. The current reading is +9.18 and above “0” suggesting the rally has further to go short term. We have other indicators that turned bullish back in August, September, and October 2022 and that may have been the major bottom for GDX.More By This Author:Bigger Trend Remains Up SPY Could Pull Back All About The S&P