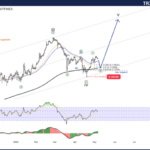
The Chart of the Day belongs to the regional airline SkyWest (SKYW). I found the stock by using Barchart’s powerful screening functions to find stocks with the highest technical buy signals, highest Weighted Alpha, superior current momentum and having a Trend Seeker buy signal then used the Flipchart feature to review the charts for consistent price appreciation. Since the Trend Seeker signaled a buy on 1/ 24 the stock gained 30.97%. 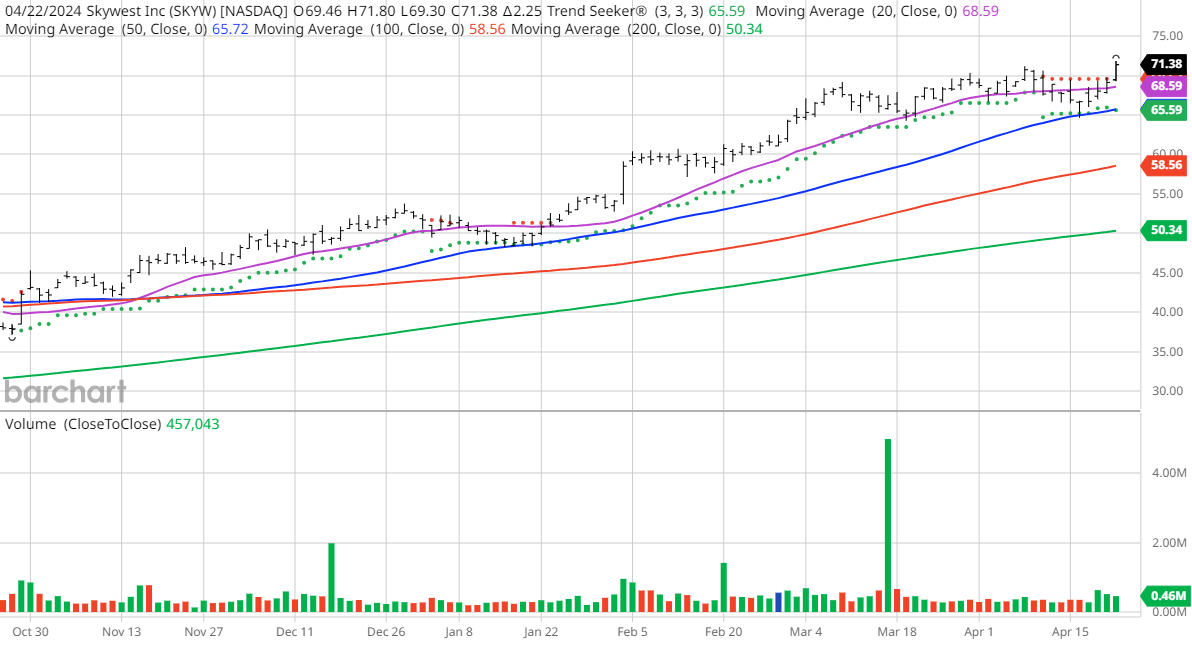 SKYW Price vs Daily Moving Averages
SkyWest, Inc., through its subsidiaries, engages in the operation of a regional airline in the United States. It operates through two segments, SkyWest Airlines and SWC; and SkyWest Leasing. The company is also involved in leasing regional jet aircraft and spare engines to third parties; and provision of on-demand charter, airport customer, and ground handling services. As of December 31, 2023, its fleet consisted of 603 aircraft; and provided scheduled passenger and air freight services with approximately 1,850 total daily departures to various destinations in the United States, Canada, and Mexico. SkyWest, Inc. was incorporated in 1972 and is headquartered in Saint George, Utah.Barchart’s Opinion Trading systems are listed below. Please note that the Barchart Opinion indicators are updated live during the session every 20 minutes and can therefore change during the day as the market fluctuates. The indicator numbers shown below therefore may not match what you see live on the Barchart.com website when you read this report.
Barchart Technical Indicators:
Fundamental Factors:
Analysts and Investor Sentiment — I don’t buy stocks because everyone else is buying but I do realize that if major firms and investors are dumping a stock it’s hard to make money swimming against the tide:
More By This Author:Chart Of The Day: Pilgrim’s Pride – Healthy Meat Alternative
Chart Of The Day: DiamondBack Energy – Proves The Analysts Wrong
MicroMarvel – Atossa Therapeutics