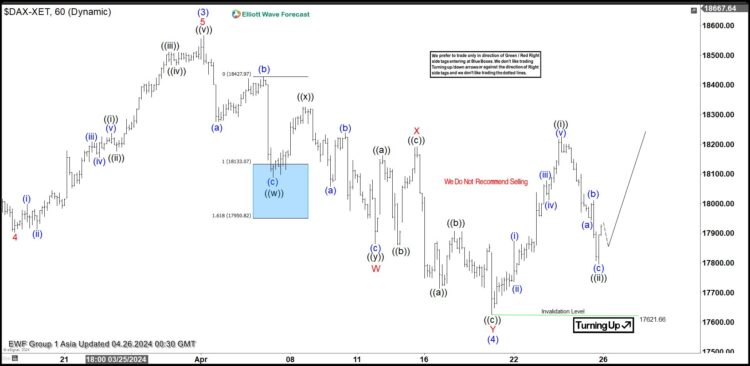
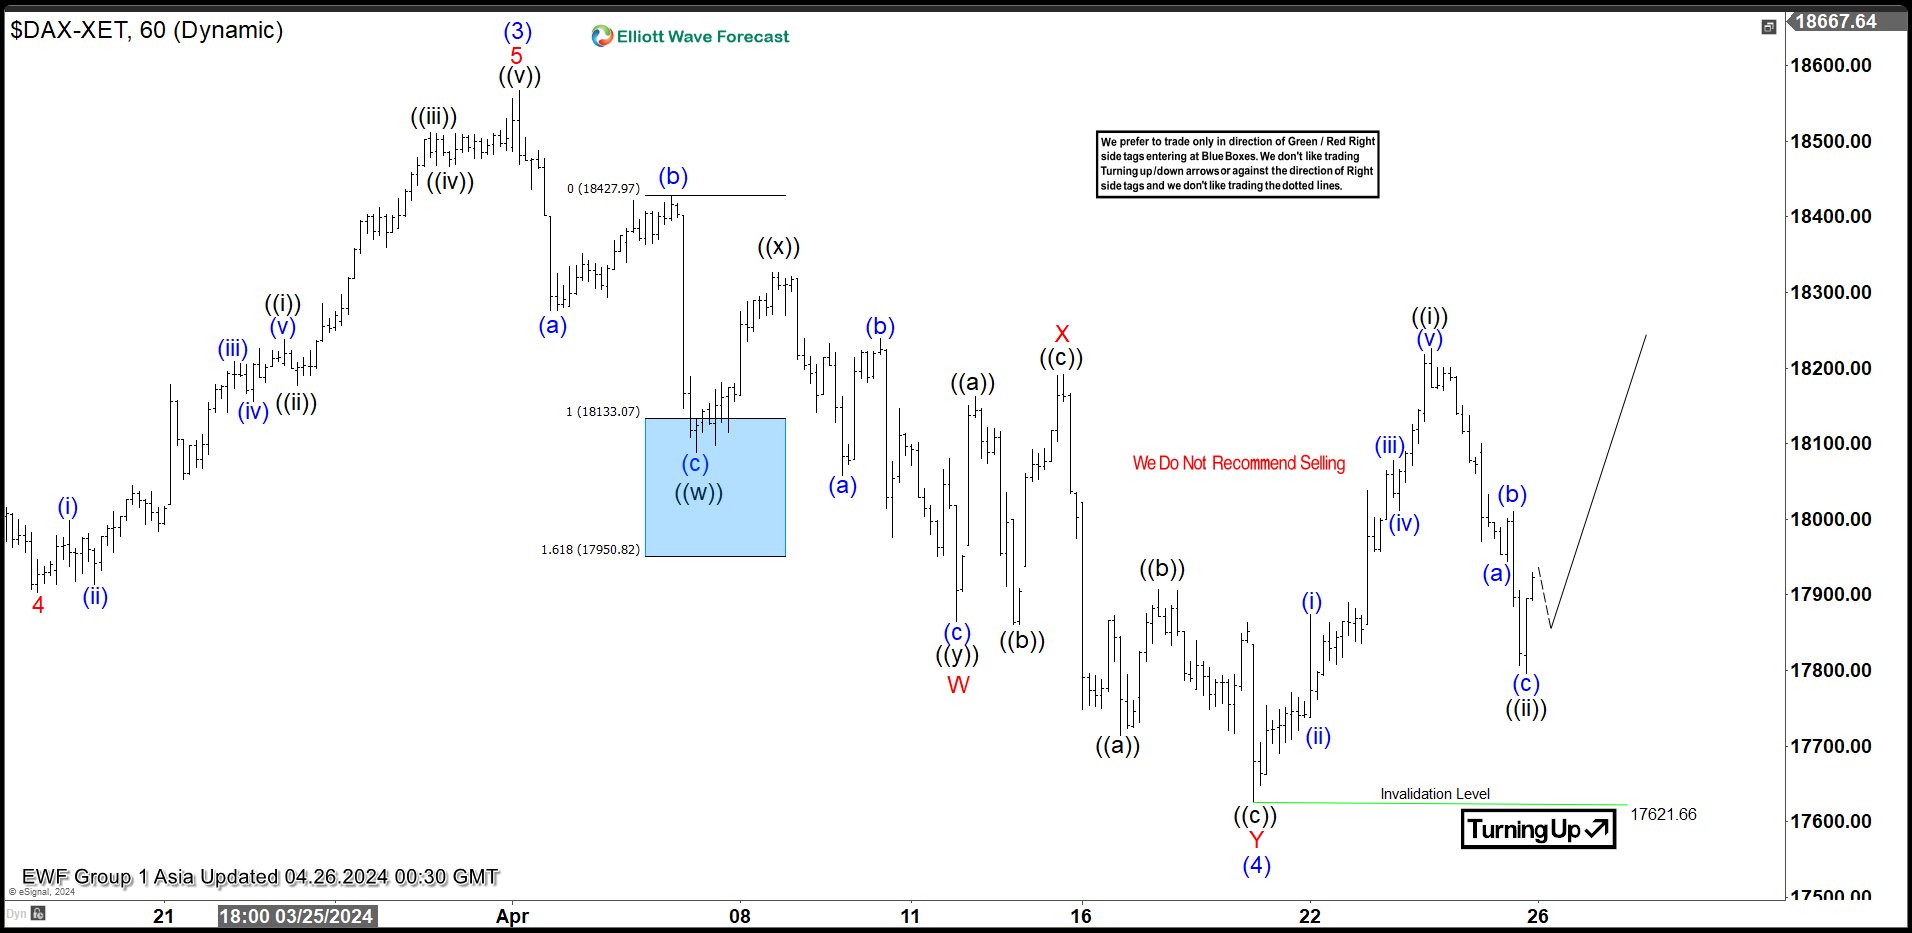
Short Term Elliott Wave View on DAX suggests rally from 10.23.2023 low is unfolding as a 5 waves impulse. Up from 10.23.2023 low, wave (1) ended at 17003.28 and dips in wave (2) ended at 16345.02. The Index extended higher in wave (3) towards 18567.16 as the 1 hour chart below shows. Down from there, wave (4) unfolded as a double three Elliott Wave structure. Down from wave (3), wave ((w)) ended at 18088.03 and wave ((x)) ended at 18326.37. Wave ((y)) lower ended at 17864.69 which completed wave W in higher degree. Wave X rally ended at 18191.95 with internal subdivision as expanded flat.The Index then extended lower in wave Y towards 17621.66 which completed wave (4). The Index has turned higher in wave (5). Up from wave (4), wave (i) ended at 17873.58 and wave (ii) pullback ended at 17738.04. the Index extended higher in wave (iii) towards 18078.1 and pullback in wave (iv) ended at 18011. Last leg wave (v) ended at 18226.32 which completed wave ((i)). Pullback in wave ((ii)) ended at 17795.96 as a zigzag. Near term, as far as pivot at 17621.6 low stays intact, expect the Index to extend higher.
DAX 60 Minutes Elliott Wave Chart
DAX Elliott Wave Video
Video Length: 00:04:38More By This Author:Elliott Wave Intraday Analysis On GBPUSD Shows 5 Waves Bullish ImpulseANF Should Resume Rally From Extreme AreasPayPal Elliott Wave Analysis – How Far Will Recovery Go?