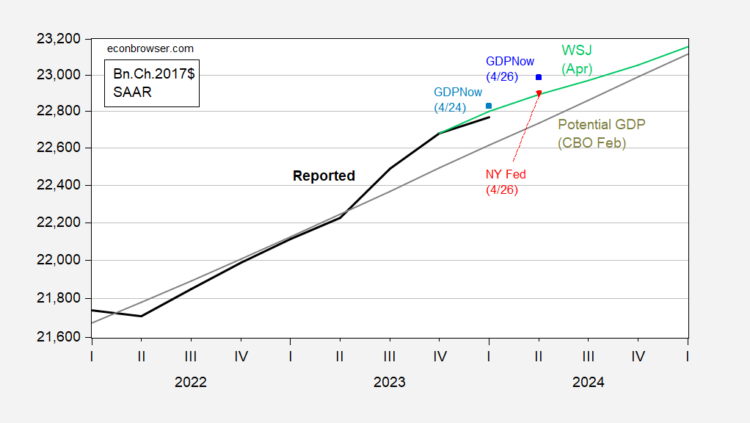
Following up on Jim’s post yesterday, thoughts on measurement error and prospects. Note that GDP surprised on the downside, at 1.6 ppts q/q AR vs. consensus 2.5 ppts. On the other hand, GDP+ grows faster, as does final sales to private domestic purchasers.  Figure 1: GDP (bold black), GDPNow as of 4/24 (light blue square), GDPNow as of 4/26 (blue square), NY Fed nowcast as of 4/26 (red inverted triangle), April WSJ survey mean (light green), CBO estimate of potential GDP (gray), all in bn.Ch.2017$ SAAR. Source: BEA (2024Q1 advance), Atlanta Fed, NY Fed, CBO Budget and Economic Outlook (February 2024), and author’s calculations.
While 1.6 ppts seems far below 2.5 ppts (q/q AR), recall that this advance estimate will be revised, perhaps substantially. As noted in this BEA note from October 2023 (for sample period 1996-2022): 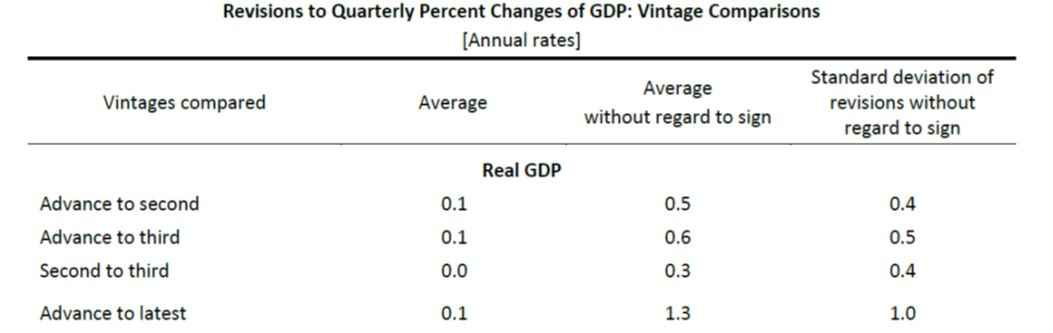 Source: BEA note.
What about alternative measures of economic activity. Below I plot reported (expenditure side) GDP, GDO (the average of GDI and GDP), and GDP+, and in a separate graph, final sales to private domestic purchasers, which is often interpreted as a better measure of aggregate demand. 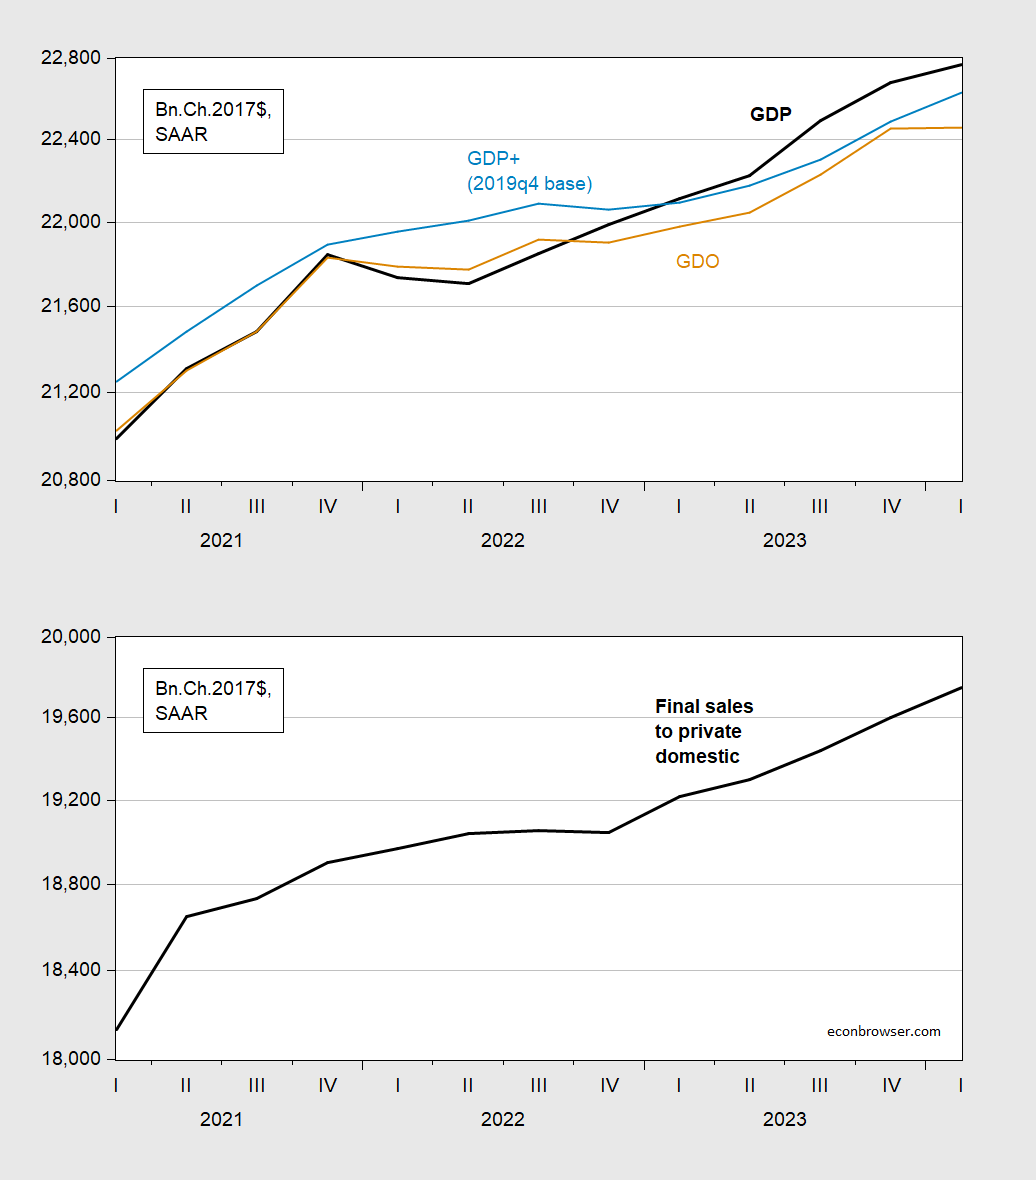 Figure 2: Top panel: GDP (bold black), GDO (tan), GDP+ indexed to level of 2019Q4 GDP (light blue). Bottom panel: Final sales to private domestic purchasers (bold black). All in bn.Ch.2017$ SAAR. GDI is estimated based on 2.2% y/y growth on net operating surplus component. Source: BEA 2024Q1 advance release, Philadelphia Fed, and author’s calculations.
On a q/q AR basis, estimated GDO is not growing at all. The missing component of GDI I filled in with a 2.2% growth in net operating surplus, using a 2.2% forecasted growth in corporate earnings for Q1. This means that real net operating surplus is assumed to resume its decline in Q1. 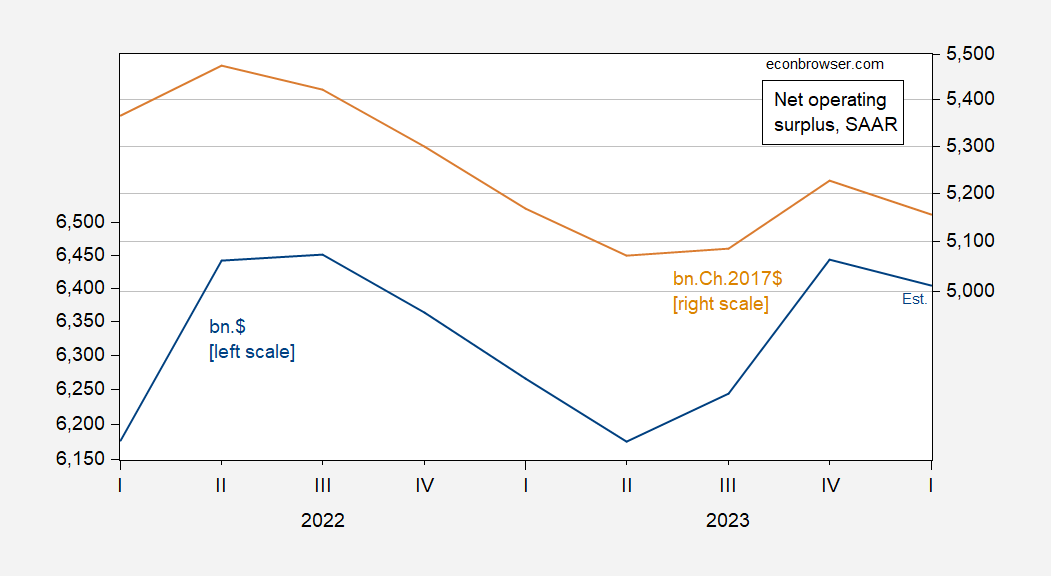 Figure 3: Net operating surplus in bn.$ SAAR (blue, left scale), and in bn.Ch.2017$, SAAR (tan, right scale). Deflated using GDP deflator. Source: BEA and author’s calculations.While both GDO and GDP+ have decelerated (the former to 0 ppts), final sales continues apace (3% q/q AR), suggesting continued momentum in aggregate demand.More By This Author:Almost Landed The Value Of The Chinese Yuan: Down 15% Since 2022M03Real Median Household Income For March