Image Source: PixabayPer a tongue-in-cheek note this past week, we apologized for single-handedly having “crashed” the precious metals’ markets with last Saturday’s post.
 Following this, on Monday, the yellow metal suffered its third-worst intraday high-to-low loss (-2.7% or -$62/oz.) in 14 months. Additionally, silver saw a -5.7% slam. Nonetheless, we plead innocent for merely going with the math, a valued leading science which few seem to do. We had recently written: “…near-term gold is very over-extended; but broad-term gold remains very undervalued…” This seems to be exactly what gold is now enduring.Through just the first third of this year, gold has already achieved our forecast high of 2375, reaching up to 2449 — although it should be mentioned that the price settled on Friday below both of those levels, at 2350. And while we are not going to re-forecast a revised target, we’d be surprised if gold does not trade higher still as the year unfolds, even if the Federal Reserve raises rates.Readers likely know that we’ve been musing since the start of this year over the Fed actually needing to raise rates, contrary to the calls for as many as three rate cuts during 2024, (such expectations having lately been reduced to just one cut toward the end of the year).But even should the Fed dutifully raise rates, such a move wouldn’t automatically deter gold from moving higher. Recall the three-year stint from 2004 through 2006: the FedFundsRate rose 425 basis points, and gold rose +69%.Thus, while gold is positioned just fine, when it comes to the stock market, it seems as if we’re in a constant state of hand-holding. On days when the S&P 500 rises +1%, financial media responses range from neutral to happy. But toss in a -1% down day, and headlines go catastrophic.And although we’re not predicting what would be a third -50% “correction” in just this century for the S&P 500, the setup is sitting there, as:
Back in “our day,” a stock was purchased to benefit from a methodically rising price based on earnings generation — plus a dividend yield. Today, stocks are purchased on expectations of their quickly quadrupling shares.Meanwhile, although April has been a losing month for the S&P 500, it has been a good month for gold. And with only two trading days remaining in April, it is close enough to the end of the month to bring up our ‘BEGOS Markets Standings.’Copper, which had been sixth in this stack a month ago, is now leading the pack (a sign of continued inflation expectations), having even surpassed oil, with gold still on the podium scantly ahead of silver. Note that despite the Dollar Index being +4.9%, gold nonetheless is +13.4%.Now, here is a look at weekly bars from one year ago-to-date, wherein we can eight-week trend (as shown by the blue dots). Moreover, in spite of last Monday’s price falter, gold has since tread water by closing well off the week’s low (2304) per the closing nub (2350) on the rightmost bar.
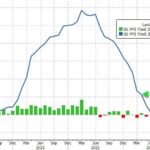
 However, the near-term “math” suggests we’ll see lower levels still. For instance, take a look at the following charts. On the left is a graphic with our BEGOS Markets near-term valuation (as shown by the smooth line) for gold based on its price movements relative to the other four primary BEGOS components (Bond, Euro, Oil, S&P).And at present per the lower left section, the price is still better than +100 points above valuation. On the right, we can see gold’s daily “candles” for the past 21 trading days (one month) wherein we find the parabolics having flipped to short (as shown by the red-encircled dot of last Monday).Such a flip was anticipated in last week’s post, and so it came to pass.
 In terms of how far further gold may fold from here, the 2247-2171 zone appears structurally supportive, (i.e. a drop from here of another -100 points wouldn’t be unexpected). And that technically pairs up nicely when the price is just over +100 points above valuation.Meanwhile, how are miners doing? They have been long overdue to get on the move, but they will likely deflate if gold slips any further over the near-term. Here’s our usual month-end chart of gold’s year-over-year daily percentage track, along with those of its key equities brethren.From worst-to-first we have: Franco-Nevada (FNV) down -19%, Newmont (NEM) down -9% (but sporting a very robust, earnings-induced up move this past week), the VanEck Vectors gold Miners exchange-traded fund (GDX) up +4%, the Global X Silver Miners exchange-traded fund (SIL) up +7%, Pan American Silver (PAAS) up +12%, Agnico Eagle Mines (AEM) up +17%, and gold itself up +18%.
 Next, here is a look at the past 21 trading days for all eight BEGOS components. The baby blue patterns reflect the day-to-day consistency of each market’s respective grey trendline. And as recently noted, there’s the adage, “follow the blues instead of the news, else lose your shoes,” which seems to apply to gold and silver for further price fallout over the near-term.But does that mean we should buy the euro, as its dots are curling upward? Given the Federal Open Market Committee’s pending “do nothing” Policy Statement and Powell’s press (on Wednesday, May 1), any “hint” of a rate cut delay (if not outright suggestion of a rate hike), would only serve to further strengthen the dollar.
 Moving on to the 10-day market profiles for the precious metals, we take another look at gold and silver. There is quite a bit of overhead volume resistance to deal with. Those prices levels of volume domination are as labeled:
 And with it being the end of the month (save for two trading days), here we have gold’s structure across the past 16 years. Note the forecast high (2375) having been achieved (and then some), followed by the price’s pullback. Still, we’ve added scaling space up toward 2600, just in case.
 As for the StateSide Economic Barometer, the two most eyed items of the past week were the first peek at Q1 Gross Domestic Product and March’s Personal Consumption Expenditures. First to the GDP: its annualized nominal Q1 growth rate was +4.7%, but +3.1% of that growth was pure inflation, so the net real GDP growth was at best a tepid +1.6%.Second to the “Fed-favored” PCE for March: both the headline and core readings maintained their +0.3% February paces, which, when annualized, comes to +3.6%, (nearly double the Fed’s targeted +2.0%). Can you say “raise?“ Nevertheless, March’s Home Sales (both New and Pending) improved, as did Personal Income and Durable Orders, the Barometer getting a boost in turn:
 Note that in the Barometer, the “live” price/earnings ratio is now 45.0x (by trailing twelve months), which, as we near the halfway mark of Q1 earnings season, hasn’t — on a cap-weighted basis — declined a material wit (as it was 46.1x at the start of earnings season).Yes, some 64% of S&P constituents have thus far reported year-over-year earnings increases: but that impossibly supports a P/E of such level, nearly double that of a dozen years ago. Also, the “all-risk” S&P 500’s yield is now 1.413% versus the “no-risk” annualized U.S. three-month T-Bill’s 5.238%. And yet the week was filled with headlines stating otherwise.More By This Author:Gold Reaps More Record GroundGold’s Fresh Highs, Fed’s Cred Demise?Gold’s Expected Detinue, Fed Hike Must Ensue?