Gold price (XAU/USD) struggles to capitalize on the previous day’s modest gains and oscillates in a narrow range during the Asian session on Friday amid mixed fundamental cues. The US GDP report released on Thursday pointed to a significant loss of growth momentum at the start of 2024 and an unwelcome pickup in inflation. This, along with the subdued US Dollar (USD) price action, acts as a tailwind for the precious metal, which is considered as a hedge against inflation. The upside, however, remains capped in the wake of hawkish Federal Reserve (Fed) expectations. Investors seem convinced that the US central bank will keep interest rates higher for longer amid sticky inflation. This remains supportive of elevated US Treasury bond yields and lends support to the Greenback. Apart from this, a positive tone around the equity markets further contributes to keeping a lid on the safe-haven Gold price. Traders also seem reluctant and prefer to wait for the release of the US Personal Consumption Expenditures (PCE) Price Index for cues about the Fed’s rate-cut path, which should determine the next leg of a directional move for the XAU/USD.
Daily Digest Market Movers: Gold price traders await more cues about the Fed’s rate-cut path before placing directional bets
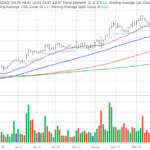
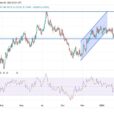
Technical Analysis: Gold price consolidates in a range, $2,300 holds the key for bulls and should act as a strong base
From a technical perspective, the XAU/USD, so far, has been struggling to make it through the 100-period Simple Moving Average (SMA) on the daily chart. The said barrier is currently pegged near the $2,345 region and should now act as a key pivotal point amid mixed oscillators on the daily chart. Meanwhile, a sustained strength beyond will be seen as a fresh trigger for bullish traders and lift the Gold price to the next relevant hurdle near the $2,371-2,372 region. The subsequent move up could extend further towards the $2,400 round figure en route to the all-time peak, around the $2,431-2,432 area touched earlier this month.On the flip side, bearish traders are likely to wait for some follow-through selling and acceptance below the $2,300 mark before placing fresh bets. The Gold price might then extend the corrective decline further towards the $2,260-2,255 intermediate support before eventually dropping to the $2,225 area and the $2,200-2,190 region, representing the 50-day Simple Moving Average (SMA).More By This Author:Gold price lacks firm intraday direction, holds steady above $2,300 ahead of US dataJapanese Yen Plummets To Fresh 34-Year Low Against USD, Around Mid-155.00s AUD/JPY Price Analysis: Bulls Steer The Market Towards 101.00, Its Highest Since 2014