Image Source: Pexels
Recently, Solana (SOL) has attracted considerable interest as its price has consistently recovered from previous lows. This positive trend followed Bitcoin’s recovery toward the $66,000 mark. Despite this bullish market sentiment, Solana has experienced a decline in its crucial on-chain metrics. However, several metrics continue to build strong buying demand for Solana, creating a mixed sentiment in the market.
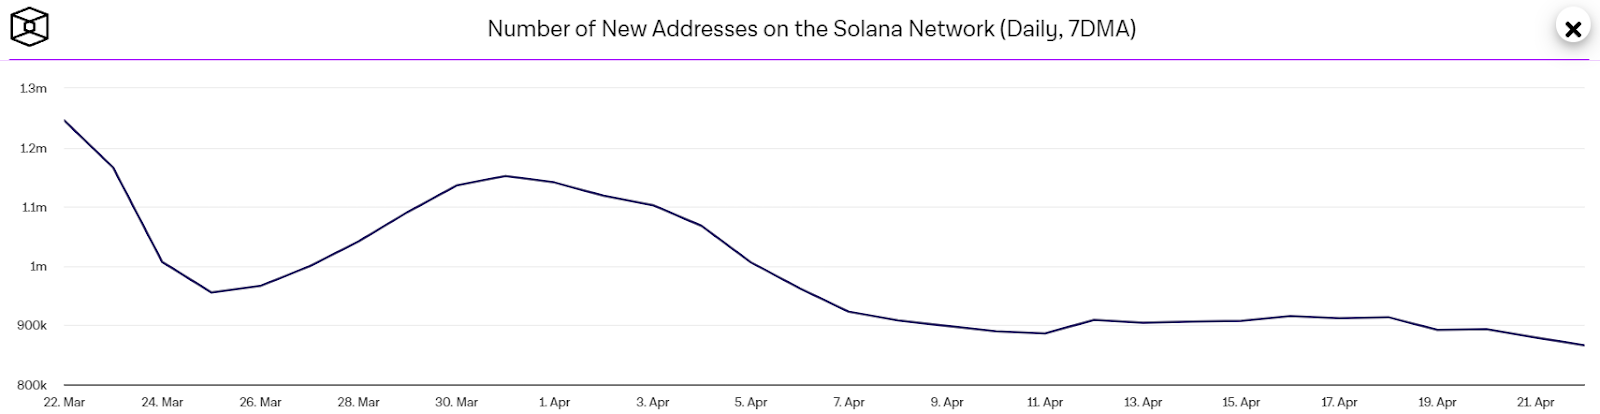
New SOL Addresses Decline By Several Thousands
Currently, the market is experiencing a battle between buyers and sellers as they both try to set a clear price trend for Solana (SOL), which is currently trading within a range-bound ascending channel. As buyers are now gaining advantage, there’s a rise in significant liquidations.ecent figures from Coinglass reveal that Solana have seen total liquidations close to $6.8 million. Of this total, buyers have faced liquidations amounting to about $2.5 million, whereas sellers have experienced liquidations totalling around $4.3 million.
According to IntoTheBlock data, Solana has seen a significant decline in its number of new addresses. The figures reveal a sharp decrease, dropping from a high of 915,000 to 866,000. This drop in new addresses suggests declining interest in the market to invest in Solana, resulting in a rising bearish sentiment.There are indications that whales might continue selling, which could lead to further dips in Solana’s price before a solid recovery is observed. It’s not unexpected that both Solana and the market are currently unstable, especially considering the pressure on miners following last week’s Bitcoin halving.According to data from IntoTheBlock, the value transferred on-chain has been increasing. The metric recently recovered from a low of $64 billion and reached $90 billion today, indicating continued buying demand.The long/short ratio has decreased to 0.8512, indicating growing bearish dominance as 54% of positions now anticipate a decline in SOL price.
What’s Next For SOL Price?
Solana has reached its 200-day Exponential Moving Average (EMA) at $158 on the 4-hour chart, which is likely to act as a significant resistance point. Buyers have been accumulating aggressively in the last few hours, breaking above immediate Fib levels. As of writing, SOL price trades at $158.1, surging over 3.3% in the last 24 hours. 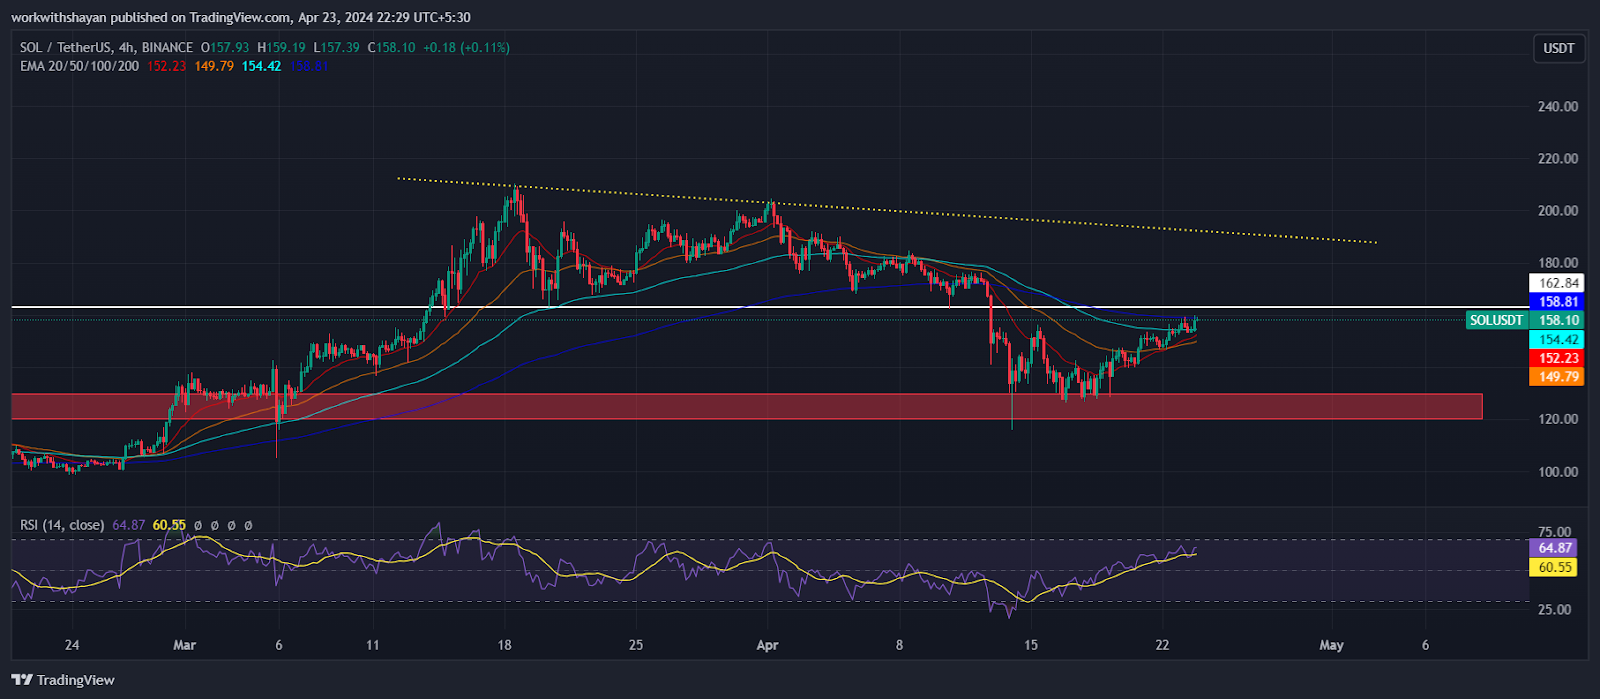
XRP Price Typically Explodes During This Time Frame After Bitcoin Halving
The Market Recovers Following The Bitcoin Halving And Awful Run