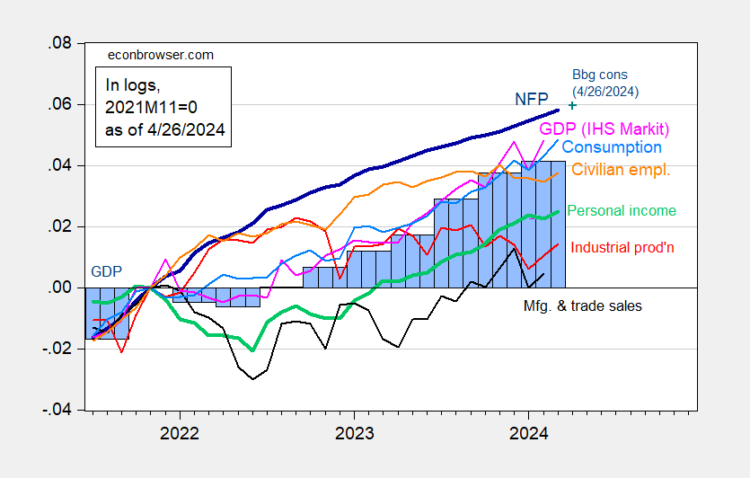
Stagflation is a term that is invoked in a CNN article today. I think of stagflation as weak growth combined with high inflation. A little context:As noted here, advance estimate for q/q GDP growth is 1.6%, below 3.4 consensus. But as discussed here, GDP+ is at 2.6%, and final sales to private domestic purchasers is running 3.0%. In addition we have the following key monthly indicators followed by the NBER’s Business Cycle Dating Committee. Figure 1: Nonfarm Payroll (NFP) employment from CES (bold blue), civilian employment (orange), industrial production (red), personal income excluding current transfers in Ch.2017$ (bold green), manufacturing and trade sales in Ch.2017$ (black), consumption in Ch.2017$ (light blue), and monthly GDP in Ch.2017$ (pink), GDP, 3rd release (blue bars), all log normalized to 2021M11=0. Source: BLS via FRED, Federal Reserve, BEA 2024Q1 advance release, S&P Global Market Insights (nee Macroeconomic Advisers, IHS Markit) (4/1/2024 release), and author’s calculations.Note that NFP, civilian employment, personal income, consumption, and industrial production all rose in March. One could use alternative proxies for GDP, monthly GDP, and NFP. I use respectively GDP+, Philadelphia Fed coincident index, and Philadelphia Fed early benchmark NFP.
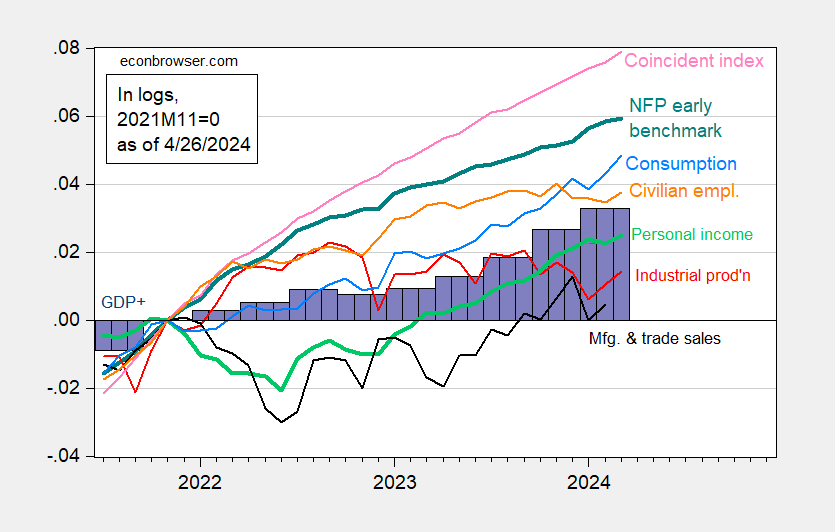 Figure 1: Nonfarm Payroll (NFP) employment adjusted by ratio of early benchmark sum-of-states to post-benchmark sum-of-states (bold teal), civilian employment (orange), industrial production (red), personal income excluding current transfers in Ch.2017$ (bold green), manufacturing and trade sales in Ch.2017$ (black), consumption in Ch.2017$ (light blue), and coincident index (light pink), GDP+ release (violet bars), all log normalized to 2021M11=0. Source: BLS via FRED, Federal Reserve, BEA 2024Q1 advance release, Philadelphia Fed [1], [2], [3]. and author’s calculations.For thinking about inflation trends, I show below instantaneous inflation (Eeckhout, 2023) for headline and for core PCE and CPI:
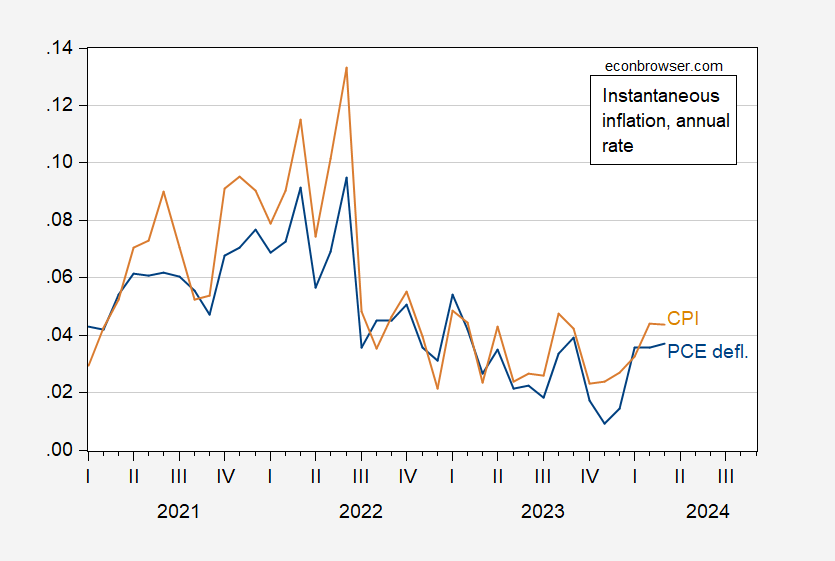 Figure 3: Instantaneous inflation for PCE deflator (blue), and CPI (tan), per Eeckhout, 2023. Source: BEA, BLS, via FRED and author’s calculations.
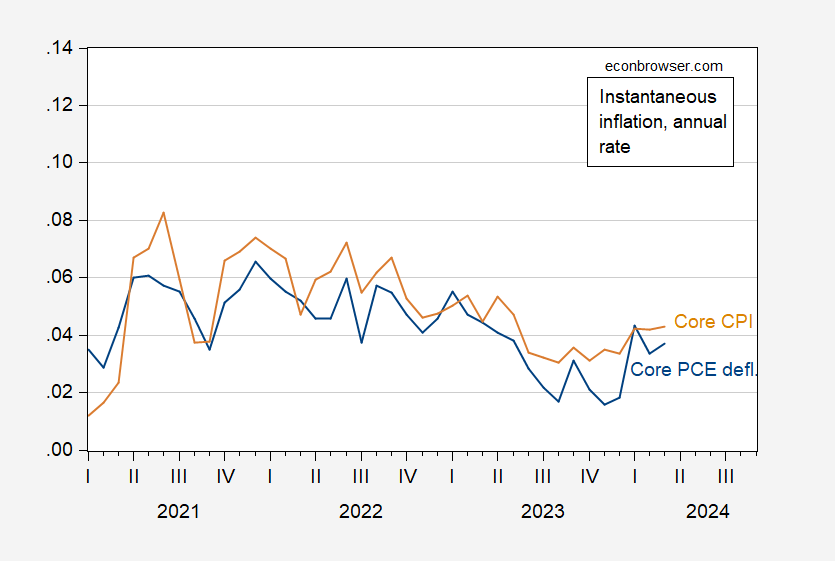 Figure 4: Instantaneous inflation for core PCE deflator (blue), and core CPI (tan), per Eeckhout, 2023. Source: BEA, BLS, via FRED and author’s calculations.With economic activity y/y growth ranging from about 2.2-2.9 ppts when trend is around 2 ppts, and trend inflation around 4 ppts, I’m not sure “stagflation” is the right term.More By This Author:GDP, Nowcasts, And Est’d GDO, GDP+, And Final Sales
Almost Landed
The Value Of The Chinese Yuan: Down 15% Since 2022M03