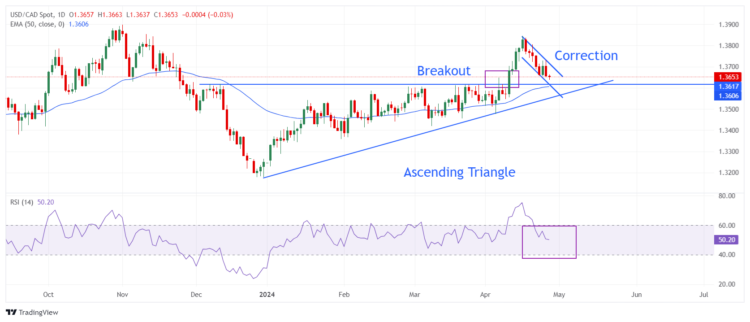
The USD/CAD pair is stuck in a tight range near 1.3650 in Friday’s European session. The Loonie asset struggles for a direction as the US Dollar consolidates ahead of the United States core Personal Consumption Expenditure Price Index (PCE) data for March, which will be published at 12:30 GMT.On a monthly basis, the underlying inflation data is estimated to have increased steadily by 0.3%. Annually, the inflation measure is seen decelerating to 2.6% from the prior reading of 2.8%. The core PCE Price Index is the Federal Reserve’s (Fed) preferred inflation gauge, which is expected to influence speculation about when the central bank pivots to interest rate cuts, which financial markets are currently anticipating from the September meeting.The US Dollar Index (DXY) is slightly up at 105.70 in the London session but fell sharply on Thursday after the US Q1 Gross Domestic Product (GDP) report showed that the economy expanded at a slower rate of 1.6% from the consensus of 2.5% and the prior reading of 3.4%. This has triggered doubts over the US economic outlook.Meanwhile, the Canadian Dollar has remained underpinned against the US Dollar this week despite firm expectations that the Bank of Canada (BoC) will start reducing interest rates from the June meeting. Easing inflation, weak Retail Sales, and loosening labor market conditions have boosted BoC rate cut bets for June.USD/CAD corrects to near the breakout region of the Ascending Triangle chart pattern formed on a daily timeframe. The retest of the breakout region is keenly tracked by investors to build fresh longs as it is considered a discounted price. The 50-day Exponential Moving Average (EMA) near 1.3620 will provide support to the US Dollar bulls.The 14-period Relative Strength Index (RSI) falls into the 40.00-60.00. The RSI is expected to rebound from 40.00 as the upside bias remains intact. However, a breakdown below the same will increase the odds of a bearish reversal.Fresh buying opportunity would emerge if the asset falls further to near April 8 high at 1.3617. This would drive the asset towards April 11 low at 1.3661, followed by the round-level resistance of 1.3700.In an alternate scenario, a breakdown below April 9 low around 1.3547 will expose the asset to the psychological support of 1.3500 and March 21 low around 1.3456.
USD/CAD daily chart 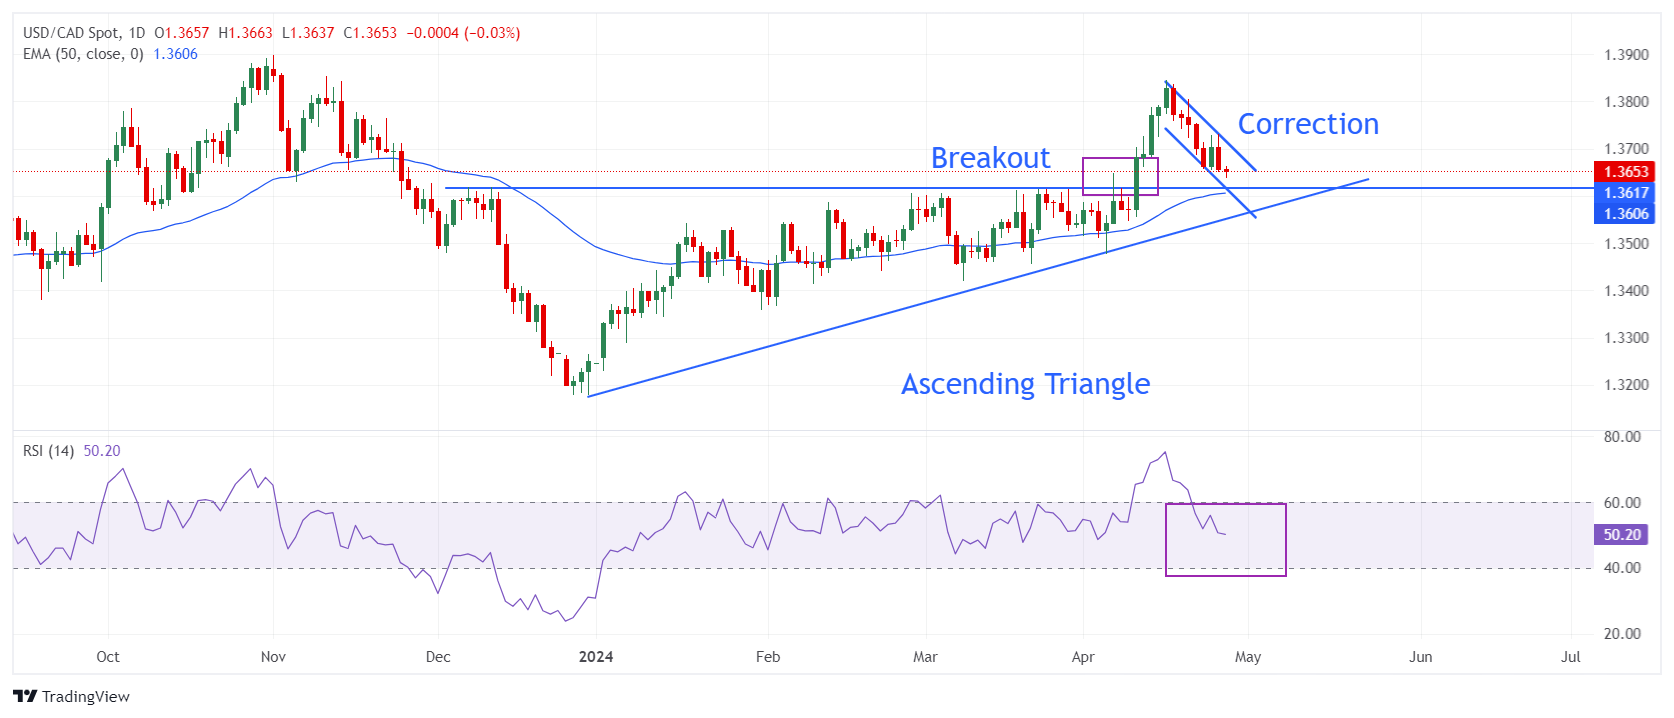
USD/CAD
More By This Author:GBP/JPY Extends Winning Spell To 196.00 After BoJ Keeps Interest Rates Unchanged USD/CAD Bounces Back To 1.3700 After Weak Canadian Retail Sales Data USD/JPY Extends Upside To 155.00 Amid Caution Ahead Of US Data, BoJ Policy