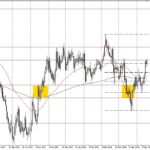
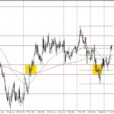
Bob Lang gives a technical analysis of the stock chart for TNX.Video Length: 00:04:56More By This Author:A Hat Tip To Warren Buffett And Long Term Investing Stifel Financial Corp: Chart AnalysisDo You Really Want To Sell In May And Go Away?
Bob Lang gives a technical analysis of the stock chart for TNX.Video Length: 00:04:56More By This Author:A Hat Tip To Warren Buffett And Long Term Investing Stifel Financial Corp: Chart AnalysisDo You Really Want To Sell In May And Go Away?
 User rating: 0.00% ( 0