Coffee Elliott Wave Analysis
Function – Counter-trend
Mode – Corrective
Structure – Possible Zigzag for B
Position – Wave B of (Y)
Direction – Wave B of (Y) is still in progress
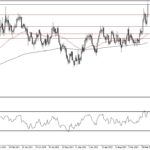
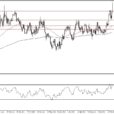
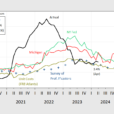
Details – Wave B is still in progress. It looks to be in the last leg for a zigzag structure. The decline could continue to 207-to-199 before returning upside for wave C.Coffee prices have embarked on a nuanced journey post the robust impulse breakout witnessed since March 19, signifying a potential completion of a significant phase. Preceding this surge, the commodity had languished within a confined sideways range for a span of three months. The ongoing descent appears poised to persist within the framework of a zigzag structure, setting the stage for an eventual upward trajectory in alignment with the broader resurgence.Delving into the daily chart reveals the unfolding of a bullish double zigzag pattern originating from 141.85 in January 2023. This intricate pattern likely constitutes the second leg of a larger corrective wave initiated back in February 2022. For analytical simplicity, our focus remains on the double zigzag structure stemming from 141.85, as depicted on the daily chart. Presently, this double zigzag is navigating through its final wave – denoted as primary degree blue wave W. Blue wave W, in turn, unfolds as a double zigzag at the intermediate degree, delineated as waves (W)-(X)-(Y). The preceding three-month consolidation period culminated in the formation of a triangle pattern, notably identified as wave (X), at the 179.35 mark. The ongoing wave Y also appears to be materializing into a double zigzag, with the current downturn representing its second leg, preceding an anticipated upward surge to finalize wave (Y) of blue Y. Zooming in on the H4 chart accentuates the present retracement, identified as wave B of (Y). This corrective wave is conceivably in the process of completing a zigzag pattern and may discover support within the Fibonacci zone spanning from 207.9 to 199.40. Consequently, a subsequent wave C is anticipated to manifest, propelling prices higher, potentially surpassing the April 18th high.However, a decisive breach beneath this support zone, coupled with a violation of the 161.8% extension level at 194.3, could herald the emergence of an impulse wave. Such a scenario could entail a more profound corrective pullback, challenging the integrity of the 179.35 low, or even signaling the culmination of wave (Y) at the April 18th peak, paving the way for a broader downturn encompassing primary degree wave Y (blue). 
 More By This Author:Unlocking ASX Trading Success: REECE LIMITED – REH Stock Analysis & Elliott Wave Technical Forecast
Polkadot Crypto Price News Today Elliott Wave Technical Analysis
AUDJPY Forex Elliott Wave Technical Analysis