Image Source: PexelsSP500 – Nasdaq 100 – RUSSELL 2000 – DAX 40 – FTSE 100 – ASX 200 Elliott Wave Technical Analysis
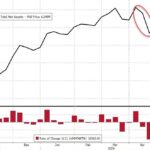
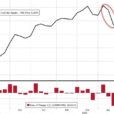
Elliott Wave Analysis Indices: SP 500 and Nasdaq 100 Wave (4). No doubt there is bearish pressure on all current Indices patterns and based on that I look at the bearish Elliott wave pattern to lower ground, that said I also look at a slim but possible bullish pattern, that still has a little downside before recovery.Video Length: 00:20:20Video Chapters
00:00 SP 500 (SPX) SPY
04:51 Nasdaq (NDX)
08:12 Russell 2000 (RUT) IWM
09:14 DAX 40 (DAX)
11:20 FTSE 100 UKX (UK100)
15:51 S&P/ASX 200 (XJO)
19:01 EndAnalyst: Peter Mathers
Source: TradingLoungeMore By This Author:Coffee Commodity Elliott Wave Technical Analysis
Unlocking ASX Trading Success: REECE LIMITED – REH Stock Analysis & Elliott Wave Technical Forecast
Polkadot Crypto Price News Today Elliott Wave Technical Analysis