Figure: 1 Gold and Silver Price ActionDaily Moving Averages (DMA)GoldGold definitely got ahead of itself and now sits way above both the 50 and 200 DMAs. Based on the chart below, the best case would be sideways action until the moving averages catch up, but the more likely scenario is a further pullback.Outlook: Bearish
 Figure: 2 Gold 50/200 DMASilverSilver is following a similar pattern. Historically, price spikes do not last and are sold off pretty hard in the weeks that follow.Outlook: Bearish
 Figure: 3 Silver 50/200 DMAComex Open InterestGoldThis is where things get interesting. Only the first leg of the up-move was driven by an increase in open interest. The second leg up was actually happening as open interest was falling. This means that futures traders had already given up on the rally in mid-March before prices really took off. These traders have already taken profits which means their selling is most likely exhausted. Furthermore, there is now cash on the sideline that can fuel the next rally.Outlook: Bullish
 Figure: 4 Gold Price vs Open InterestSilverSilver is different than gold here because open interest and price action were much more correlated during the price spike. Open interest remains high relative to recent history which means that more sellers could come in quickly if prices do not hold here.Outlook: Neutral to bearish
 Figure: 5 Silver Price vs Open InterestMargin Rates and Open InterestThe CME uses margin requirements to pull momentum out of the futures market. This is usually done to halt explosive up moves and contain them, but can be used in quick bear markets as both shorts and long are subject to margin requirements. Margin increases force traders to put up more capital or sell off contracts to meet requirements. Managed Money (see CoTs report) are more sensitive to margin increases as they tend to be more leveraged and capital constrained, so margin increases typically force them to liquidate positions (if they are long prices go down as they sell, and if short prices go up). More often, traders are long, and higher margins cause forced selling.GoldMargin rates have been pushed to their highest level since April 2021. Margin rates probably won’t go too much higher. They have already had the impact of containing open interest. As shown above, the price continued higher despite a decrease in open interest and an increase in margin! This means that futures traders were not responsible for the latest upmove in gold. Thus, an increase in margin could do little to keep prices down if another upmove were to commence. Because margin rates are already elevated the CME’s ability to contain the next big run-up will be limited.Outlook: Very Bullish
 Figure: 6 Gold Margin Dollar RateSilverOnce again, the situation in silver is not similar to gold. This market looks more like historical instances. This means that any upmove in silver is likely to be met with a higher margin putting a cap on prices.Outlook: Neutral to bearish
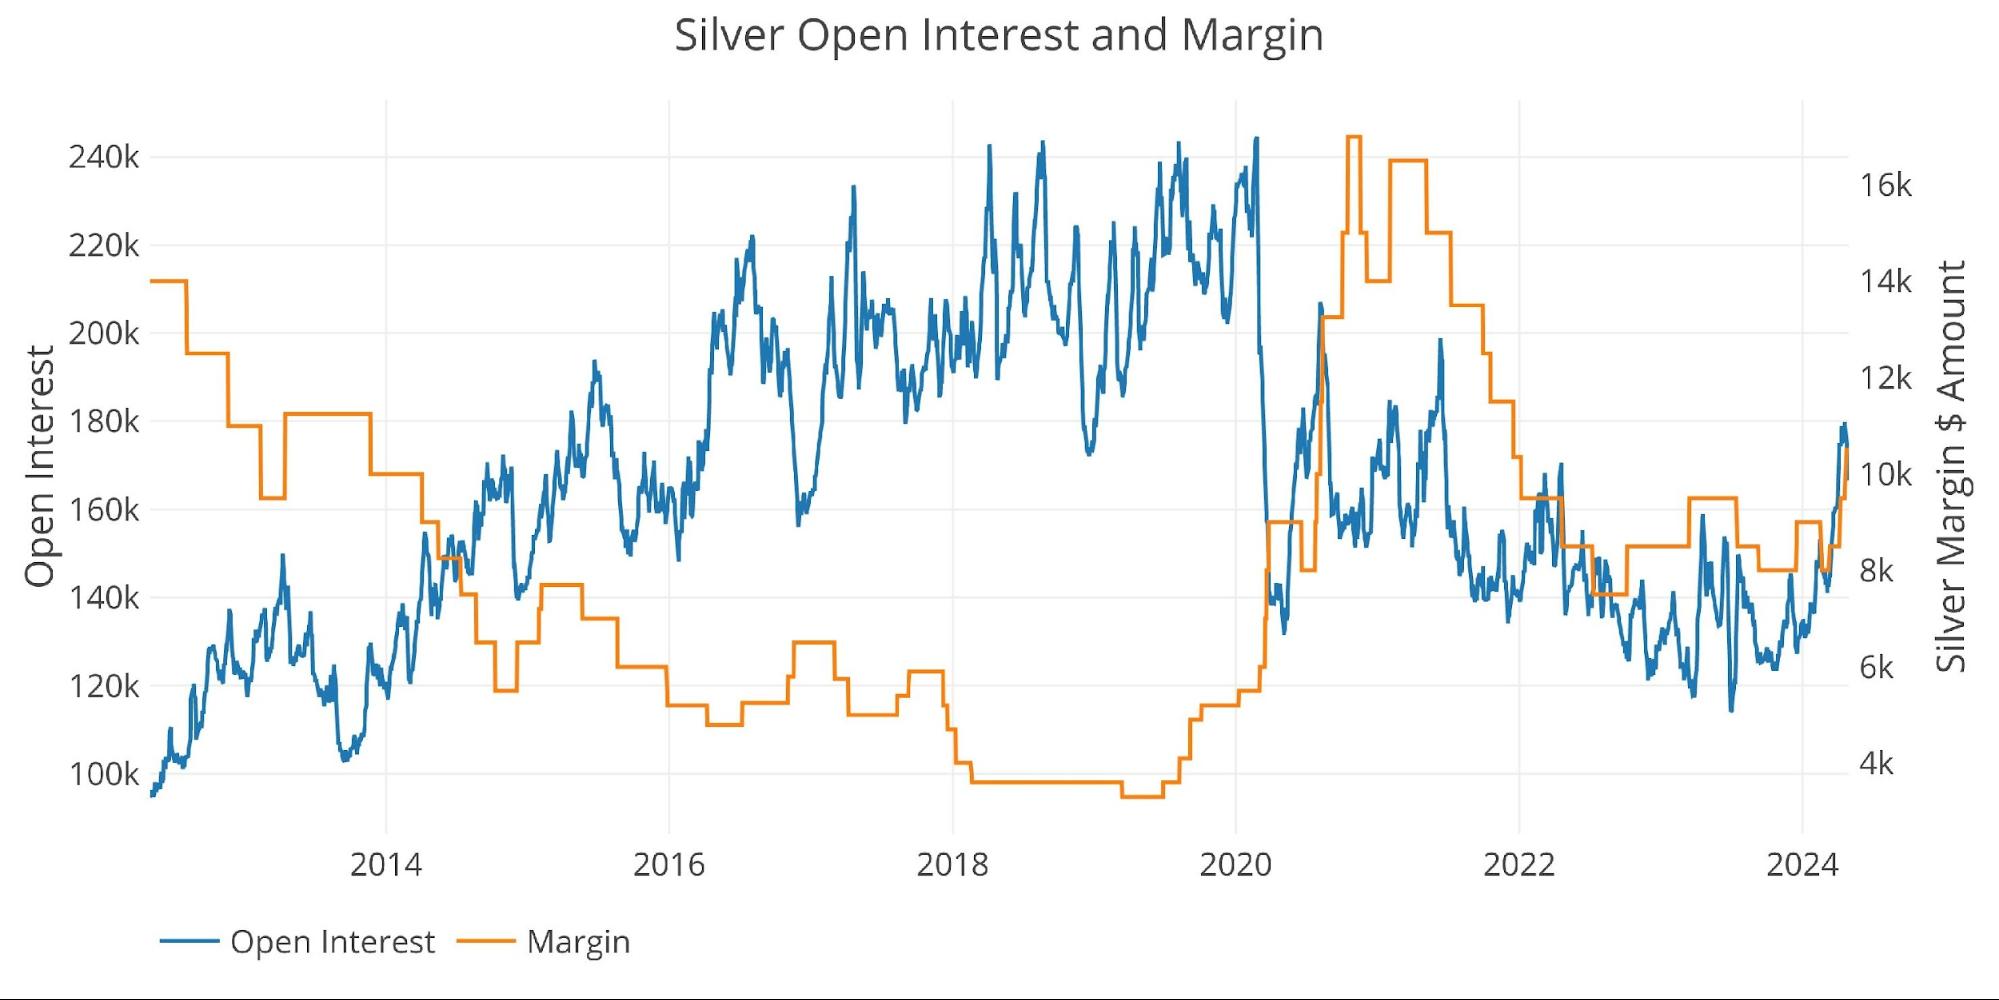 Figure: 7 Silver Margin Dollar RateGold MinersThe gold miners have been consistently leading the price of gold in both directions for years. That said, the miners did not fully participate in the last move up in gold which further suggests that traders are not in control of this market right now. This is likely not a reliable indicator at the moment.Outlook: Neutral
 Figure: 8 Arca Gold Miners to Gold Current TrendThe chart below shows the longer-term historical relationship. The miners have been absolutely punished over the last decade as stock traders have never bought into the current move in gold. That leaves these stocks deeply undervalued and set up for an explosive move when the gold price takes off.
 Figure: 9 Arca Gold Miners to Gold Historical TrendTrade VolumeThe final indicator is trade volume on the CME. This is related to but not exactly tied to open interest. Higher trade volume with flat open interest can mean churn. Higher trade volume can also be met with increases or decreases in open interest if buyers or sellers are in control.In gold, there is once again evidence that futures traders were not driving the price spike. Trade volume was only slightly above average but nowhere near on par with previous price increases. This is clear when looking at 2020 when gold last spiked higher along with trade volume. Once again, it is clear that traders did not drive the latest price gains in gold.Outlook: Very Bullish
 Figure: 10 Gold Volume and Open InterestOnce again, silver is diverging from gold. It is clear that trade volume in the futures market was driving prices higher. This means that silver is more susceptible if traders decide to exit or even short the market.Outlook: Neutral to Bearish
 Figure: 11 Silver Volume and Open InterestConclusionOn the surface, the recent price spikes in gold and silver look a lot like history where big price spikes run out of steam and are then sold off over the coming weeks and months. The rest of the data easily aligns with this narrative in silver, but not in gold. It is very clear that something else is going on in gold. The second price spike in gold did not originate on the CME.It looks like gold got triggered somewhere outside the CME and then silver traders were forced to play catch-up. These same traders were all too ready to sell at the first sign of trouble as they always do. What they are missing is that the floor on gold should be much higher because you don’t have gold traders itching to sell. The gold traders who sold were the ones who jumped onto the first price spike (Mar 1- Mar 14). This likely means their selling is close to exhausted.Gold may not immediately rebound and jump higher (though it may), but it is much less likely that another major down leg is seen in the near term. The upside in gold is much bigger than the downside, and silver tends to follow gold.More By This Author:Economy Is Barreling Toward Stagflation: Gold Wrap For Friday, April 26If 10-Year Yields Surpass 5%, Say Hello To QE (And Massive Inflation)California’s New Minimum Wage: A Cure That Exacerbates The Sickness