The stock market is still on the upswing. For all the anti-Fed pundits, the market seems to be going with Chairman Powell for now.
 Chart: The New York TimesMost actives were led by Tesla (TSLA), up 2.0%, followed by Apple (AAPL), down 0.9%, and Pfizer (PFE), up 1.3%.
 Chart: The New York TimesIn early morning futures trading, S&P 500 market futures are down 2.50 points, Dow market futures are up 5 points and Nasdaq 100 market futures are down 29 points.TalkMarkets contributor Lucas Downey asks Could A MONSTER Gain Be Coming? “Our market North Star, the Big Money Index (BMI), has been in free-fall for weeks…even dropping further after Wednesday’s intraday pump and slump. But there’s good news. A monster bullish setup is forming in our data. If history is any guide, we are looking at a crowd-stunning rally coming later this year. Now is not the time to get fearful. It’s time to get cheerful.The all-clear signal is not here yet. That’s evidenced by the Big Money Index sinking day after day. Seasonal volatility is causing overall weakness and rotational action. Inflows are seen in more cyclical areas like Energy, Financials, and Industrials as money is fleeing Big Tech.Given Tech’s huge market weight in the S&P 500, those outflows are why major large-cap indices are anchored. Below shows how the BMI continues to spiral, last hitting a YTD low of 47.2%:
 But while I’ve been pointing to overall weakness in our data since February, today’s data-driven environment is actually quite rare. Our BMI has been trending lower since December 29. That’s a long period…one that suggests a major ultra-bullish signal is approaching…When we single out similar BMI pullbacks to now, we find six instances ranging from 1998, 2019, and 2020. What we find is stocks struggle near term, with the S&P 500 falling 4.1% a month later and 1.2% three months later. But the underlying message that you need to heed is stocks zoom six and 12 months later, with average gains of 14% and 20.3% respectively.Here’s the bottom line: Investors are looking for clarity in this turbulent market. Data has more answers than the news ever will. We are currently witnessing a rare 40+ point drop in the Big Money Index (BMI). History says a little more pain will lead to monster gains in the coming months.”Contributor Mish Schneider explains When Investors Should Look At The Monthly Charts“I have used monthly charts to determine support and resistance levels.Moreover, this timeframe is often the best indicator for either the end of a countermove or the start of a bigger megatrend.The 23-month moving average (blue) and the 80-month moving average (green) are my go-to’s.One is a shorter 2-year business cycle while the other is about a 6–7-year business cycle.Here are a bunch of monthly charts that have my attention.Often, a picture says 1000 words.Alibaba (BABA)- the end of the correction or the start of a much bigger move? BABA has traded below the 23-month moving average since 2021.
 Natural Gas- sure get bullish-but the road back to the monthly MAs is long and perilous for now.
 How clear is this? Tesla is below the 23-month MA but above the 200-month MA.
 What about Granny Retail XRT?Above the 23-month so in expansion. But also having an inside month to May.The best we can say from the chart-Granny looks constructive and we err to bullish. But there is more to prove.”Schneider has additional examples and charts in the full article.Looking at oil, TM contributor Akhtar Faruqui finds WTI Trades Around $78.50 With A Positive Sentiment After Israel’s Strike On Rafah City“West Texas Intermediate (WTI) crude oil price hovers around $78.50 per barrel during the Asian trading hours on Tuesday. The Oil prices experienced a slight increase following Israel’s strike on Rafah in Gaza. Meanwhile negotiations for a ceasefire continued without resolving…
 UnsplashBased on analyst forecasts, a Reuters poll conducted on Monday indicated that crude Oil and product stockpiles in the United States (US) were anticipated to have declined last week. The average expectation was for crude inventories to have decreased by approximately 1.2 million barrels in the week ending May 3.Amos Hochstein, US President Joe Biden’s energy adviser, said on Monday that the US possesses an ample supply of Oil in the Strategic Petroleum Reserve (SPR) to tackle any supply-related worries and is carefully monitoring market conditions to determine its utilization…The Biden administration has halted the repurchase of Oil for the reserve recently, as crude Oil has been trading above the targeted price of $79.00 per barrel.”Contributor Joseph James, always looking to make a quick buck, says This Breakout Pullback Could Earn Huge Profits On Tuesday“Markets have been melting higher ever since last Friday’s Non-Farm Payrolls…Anytime I see a “Big Move” like this, there are (2) two trades I look for the following day – are you ready?
E-Mini S&P (ES):

E-Mini Nasdaq (NQ):

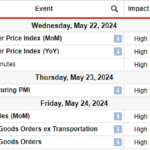
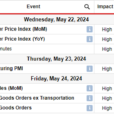
Getting back to policy, TalkMarkets contributor and economist Scott Sumner asks Was High Inflation Inevitable?“During the period following the 2020 Covid pandemic, many countries experienced relatively high inflation. This reflects two factors:
1. All countries were hit by shocks such as Covid-related supply chain disruptions and the Ukraine war.
2. Most countries enacted very extensive stimulus programs, which had similar effects in each case.It was appropriate to allow some increase in inflation in response to negative supply shocks. That’s the whole idea behind “flexible” average inflation targeting. But the actual rate of inflation also reflected excessive aggregate demand growth and thus was inappropriately high in many countries, including the US. I worry when people seem to suggest that there wasn’t much the Fed could have done about the inflation surge because it also occurred in many other nations. In fact, not all countries experienced extremely high inflation. Notice that China (red line) and Switzerland (blue line) experienced some increase in inflation, but much less than in the US (green line): In a podcast with David Beckworth, former Fed vice-chair Richard Clarida suggests that the similar pattern experienced by most countries suggests that differences in monetary policy regime were not crucial in this particular case:
The most important thing to remember about the lessons learned from the inflation surge post-pandemic is that it was very similar across countries, across implementation, and across policy strategies. So, single mandate inflation targeters, like the Bank of England, inflation was too high. Single mandate inflation targeters, for the Eurozone, inflation was too high.
Inflation was too high in Switzerland. It was too high in Australia. It was too high in Canada. Moreover, with the exception of the SNB and the Norwegian Central Bank, all of the other advanced economy inflation targeters also chose to fall behind the curve, in that they did not begin to hike rates until core inflation in their country had moved well above target. So, it was something about initial conditions— inflation had been too low for a decade— about the magnitude and complexity of the shocks, because they impacted both supply and demand, that led central banks to do very similar things and to have very similar liftoffs, very similar inflation history, and now very similar disinflation.
So, I think and I predict that, with the passage of time, scholars will look back on this period and they will not think that it revealed very much about inflation targeting versus flexible average inflation targeting versus single mandate versus dual mandate. They think it will reveal something about the initial conditions and the magnitude and the complexity of the shocks…
I would argue that the cross-country pattern we see suggests that some policy regime differences are more important than others…It’s worth noting that Japan’s currency has recently depreciated very sharply against the US dollar, whereas China’s currency has depreciated only very modestly…Nothing in the Clarida interview made me optimistic about the upcoming review of the Fed’s policy regime. It seems clear to me that, at a minimum, the average inflation-targeting regime needs to be made symmetrical, but I don’t see Fed officials advocating that sort of change. I hope I’m wrong, but I expect more of the same—a policy “rule” that allows far too much discretion.”That’s a wrap for today.Peace. PexelsMore By This Author:Thoughts For Thursday: Lingering Inflation
Tuesday Talk: Market Stays Up Awaiting FOMC Meeting
Thoughts For Thursday: Stock Indices Stay Steady Amid Corrections