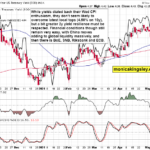
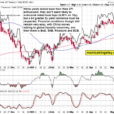
Wheat Elliott Wave Analysis Function – TrendMode – TrendStructure – Impulse for wave (A)Position – Wave 5 of (A)Direction – Wave 5 of (A) is still in playDetails – We can confirm that the recovery from 523’6 is an impulse for (A). We should see a further extension to the 661’4-703’2 Fibonacci zone where wave (B) might begin. Not much has changed since the previous update.Wheat is on the verge of its most significant recovery since October 2022. It seems that the two-year bearish cycle from March 2022 to March 2024 has concluded. Consequently, the current recovery appears to be correcting the entire cycle, giving it the advantage to surge higher than the previous bounces during the bearish cycle.On the daily chart, we can identify a bearish impulse wave sequence between the March 2022 peak of 1364’4 and the March 2024 low of 523’6. The impulse wave was completed with an ending diagonal pattern. Price broke out of the diagonal, initiating the recovery. However, it’s not expected to recover the entire two-year bearish trend. This should mark the beginning of a correction towards 842’2-942 at least. Of course, there is potential for the price to fail to reach the Fibonacci retracement zone or even surpass it. It’s too early to determine the structural path the price will take to complete this corrective cycle. Most likely, it will be a zigzag or a double zigzag because the price breaks out of the diagonal wave (5) with an impulse structure. Therefore, we can expect an intermediate degree (1)-(2)-(3)-(4)-(5) to complete the primary wave ‘A’ of a single zigzag or an (A)-(B)-(C) for wave ‘W’ of a double zigzag. Since both scenarios imply an upside direction, we can start with one for simplicity and adjust as we gather more price action in the coming weeks. In this case, we are initiating a double zigzag forecast for the expected bullish corrective cycle.On the H4 chart, wave (A) is nearing completion of an impulse structure. We can anticipate it to finish at the 661-703 Fibonacci extension zone. Wave (B) is now correcting wave (A) downwards before the price resumes its upward movement for (C). Therefore, as long as 523’6 is not breached, traders would be looking to buy dips as the long-term bullish correction progresses. 
 More By This Author:British Pound/Japanese Yen (GBPJPY) Forex Elliott Wave Technical Analysis
Elliott Wave Technical Analysis: NEO/USD Crypto Price News
Commodity Market Elliott Wave Analysis: Bitcoin, ETH/USD, DXY, Gold, Silver, Uranium, Oil, Gas